

Build a CSV Sales Toolkit : Day 1 - CSV Sales Cleaner
Today we build a Python program that loads a messy CSV, see it in a table, click a button, and watch the data transform — bad values fixed, missing cells filled.

Projects in this week’s series:
This week, we build a CSV Sales Toolkit that cleans messy data, generates insightful reports, and processes whole folders of files at once — the exact workflow of real data work.
Why build this? Because real-world data is always messy. Inconsistent capitalization, stray whitespace, dollar signs in number columns, missing values — every dataset has them. The ability to reliably clean data is one of the most practical skills in all of Python.
What you’ll learn: This series teaches you data cleaning, type conversion, missing-value handling, aggregation and reporting, and batch file processing — the core skills behind data analysis and automation.
Why this matters: By Day 3, you’ll have a tool that points at a folder of monthly sales files, cleans every one, and produces a single consolidated business report. That’s a genuinely useful piece of software.
Day 1: Visual CSV Cleaner (Today)
Day 2: Sales Analyzer & Report
Day 3: Batch CSV Processor
Today’s Project
We start at the foundation of all data work: cleaning. But instead of a script that runs and prints text, we’re building a visual desktop app. You load a messy CSV, see it in a table, click a button, and watch the data transform — bad values fixed, missing cells filled, all in front of you.
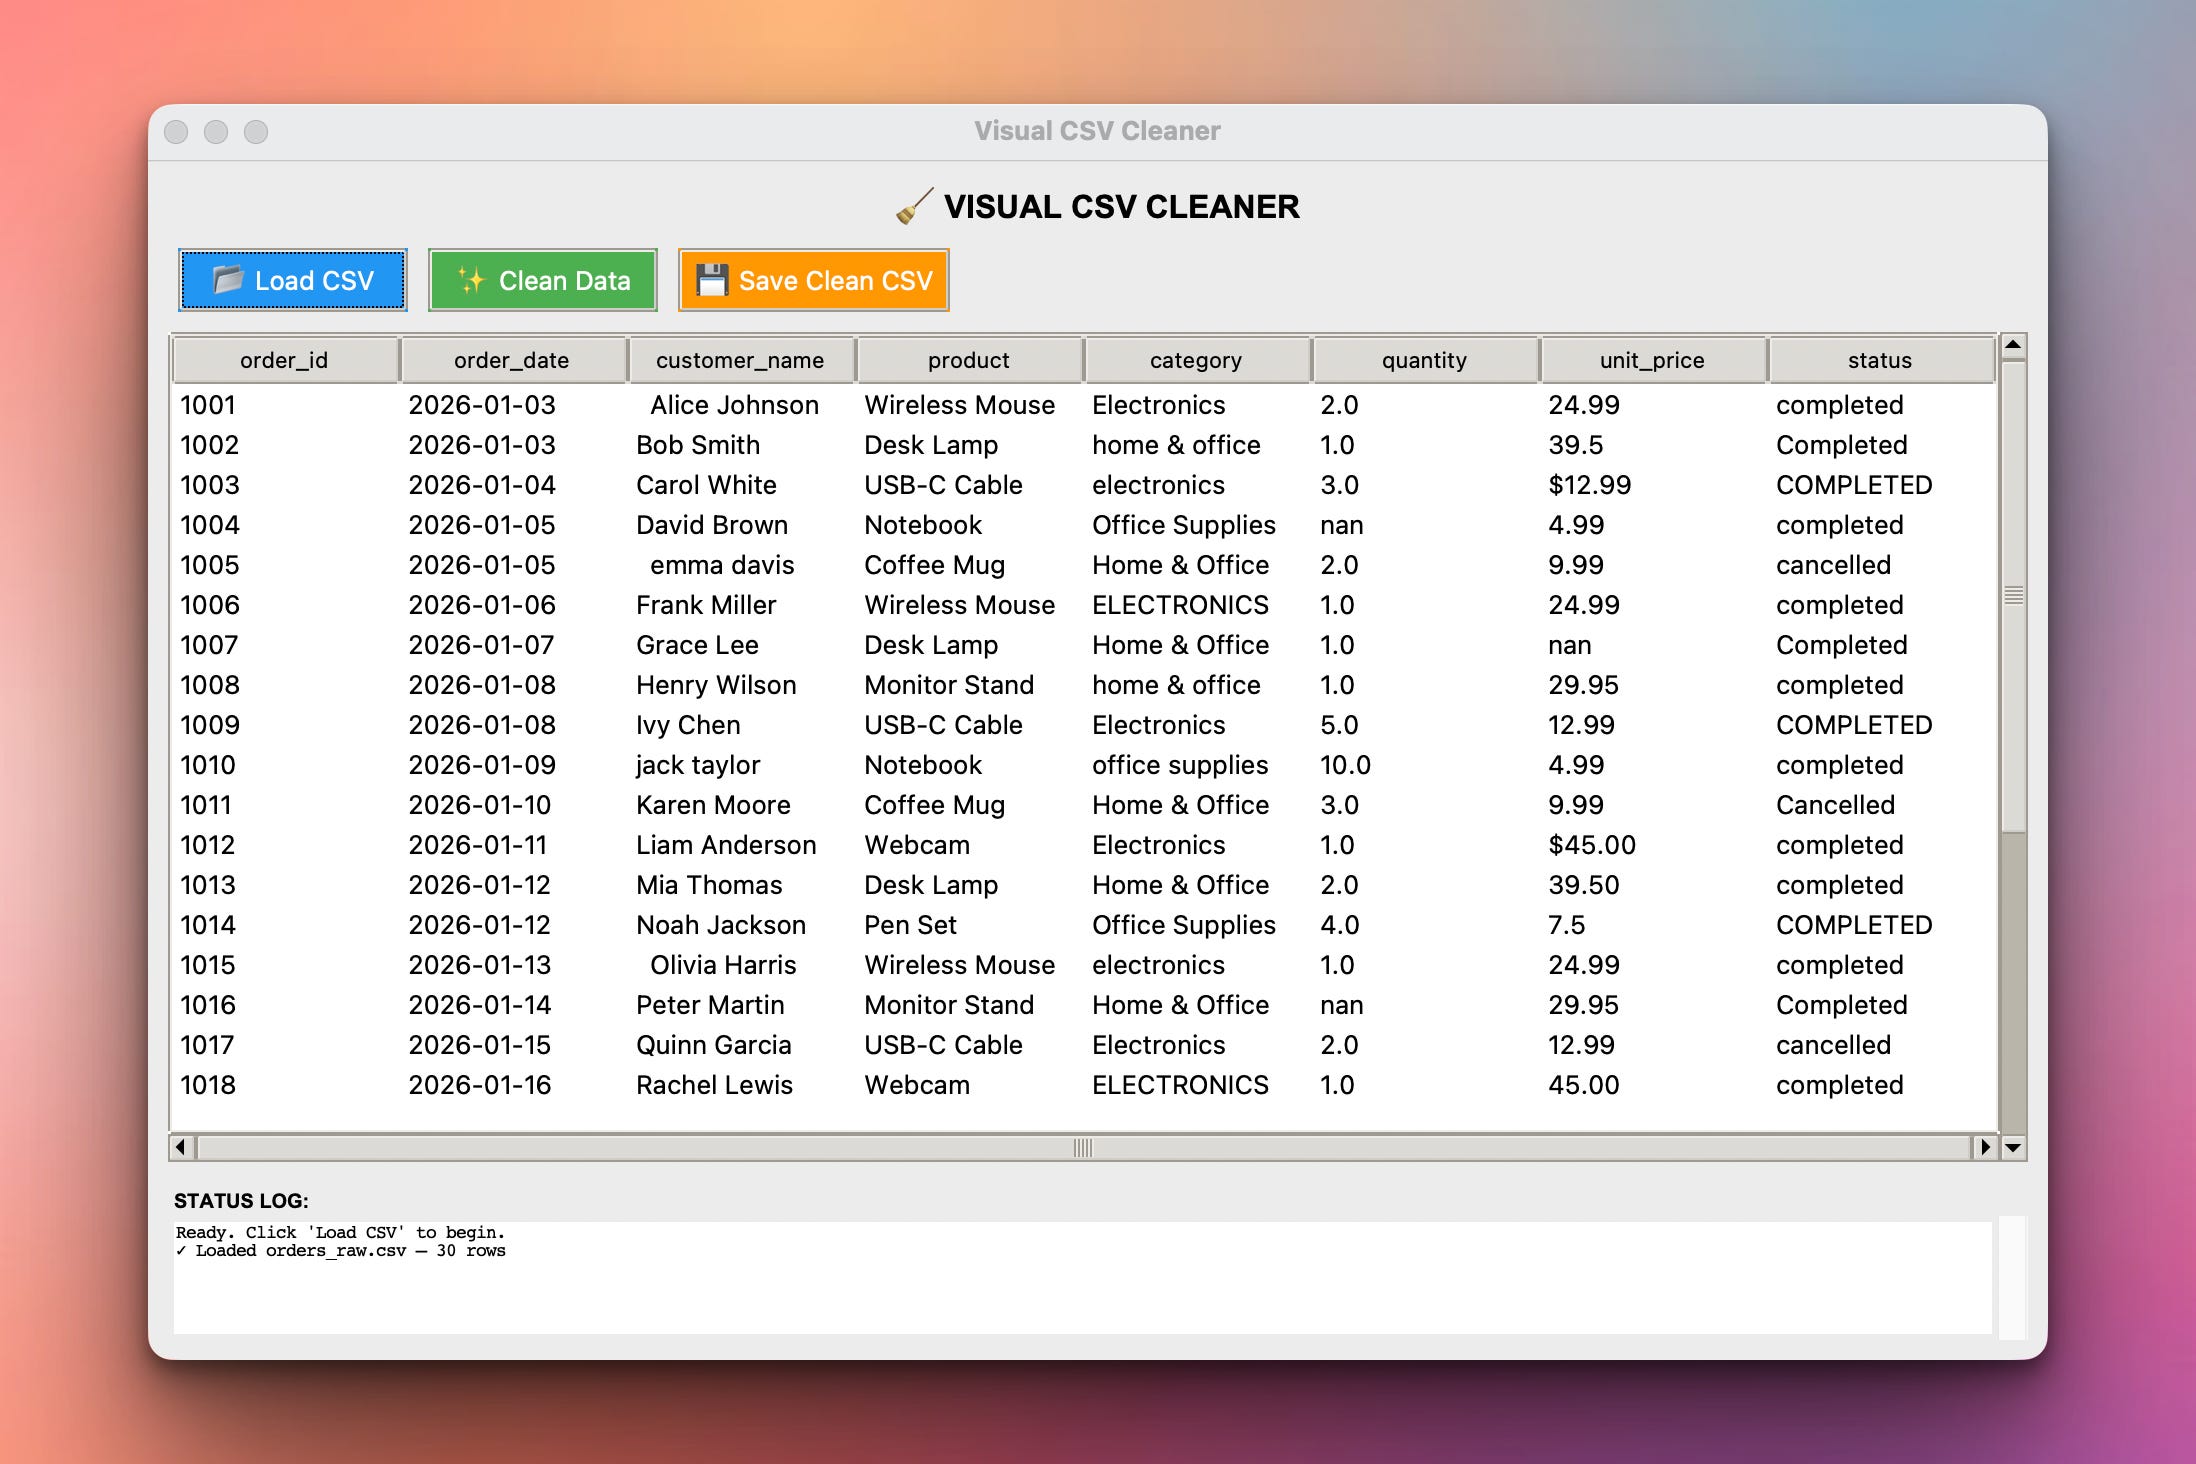
The input file looks fine at a glance. But it has stray whitespace, three different spellings of “Electronics,” dollar signs stuck in the price column, and missing values. Today you build a tool that fixes all of it — and shows you the difference.
Project Task
Build a visual CSV cleaner with Tkinter that:
Loads a raw orders CSV and displays it in a table (Treeview)
Shows a “before” view of the messy data
Cleans the data on a button click:
Strips whitespace from text columns
Standardizes category names to Title Case
Standardizes order status to lowercase
Removes
$signs and converts prices to numbersConverts quantity to whole numbers
Fills missing values sensibly
Adds a calculated
total_pricecolumn
Displays the cleaned “after” data in the same table
Shows a status log of exactly what was cleaned
Saves the cleaned data to a new CSV via a Save button
This project gives you hands-on practice with pandas data cleaning, Tkinter GUIs, the Treeview table widget, and connecting a data pipeline to a visual interface — a practical mix of data and app-building skills.
Expected Output
Running the app:
python csv_cleaner.py
Application Window:
Running the code will produce this desktop app. Here we have already loaded the orders_raw.csv file which you can download here:
After clicking “Clean Data” we see this:
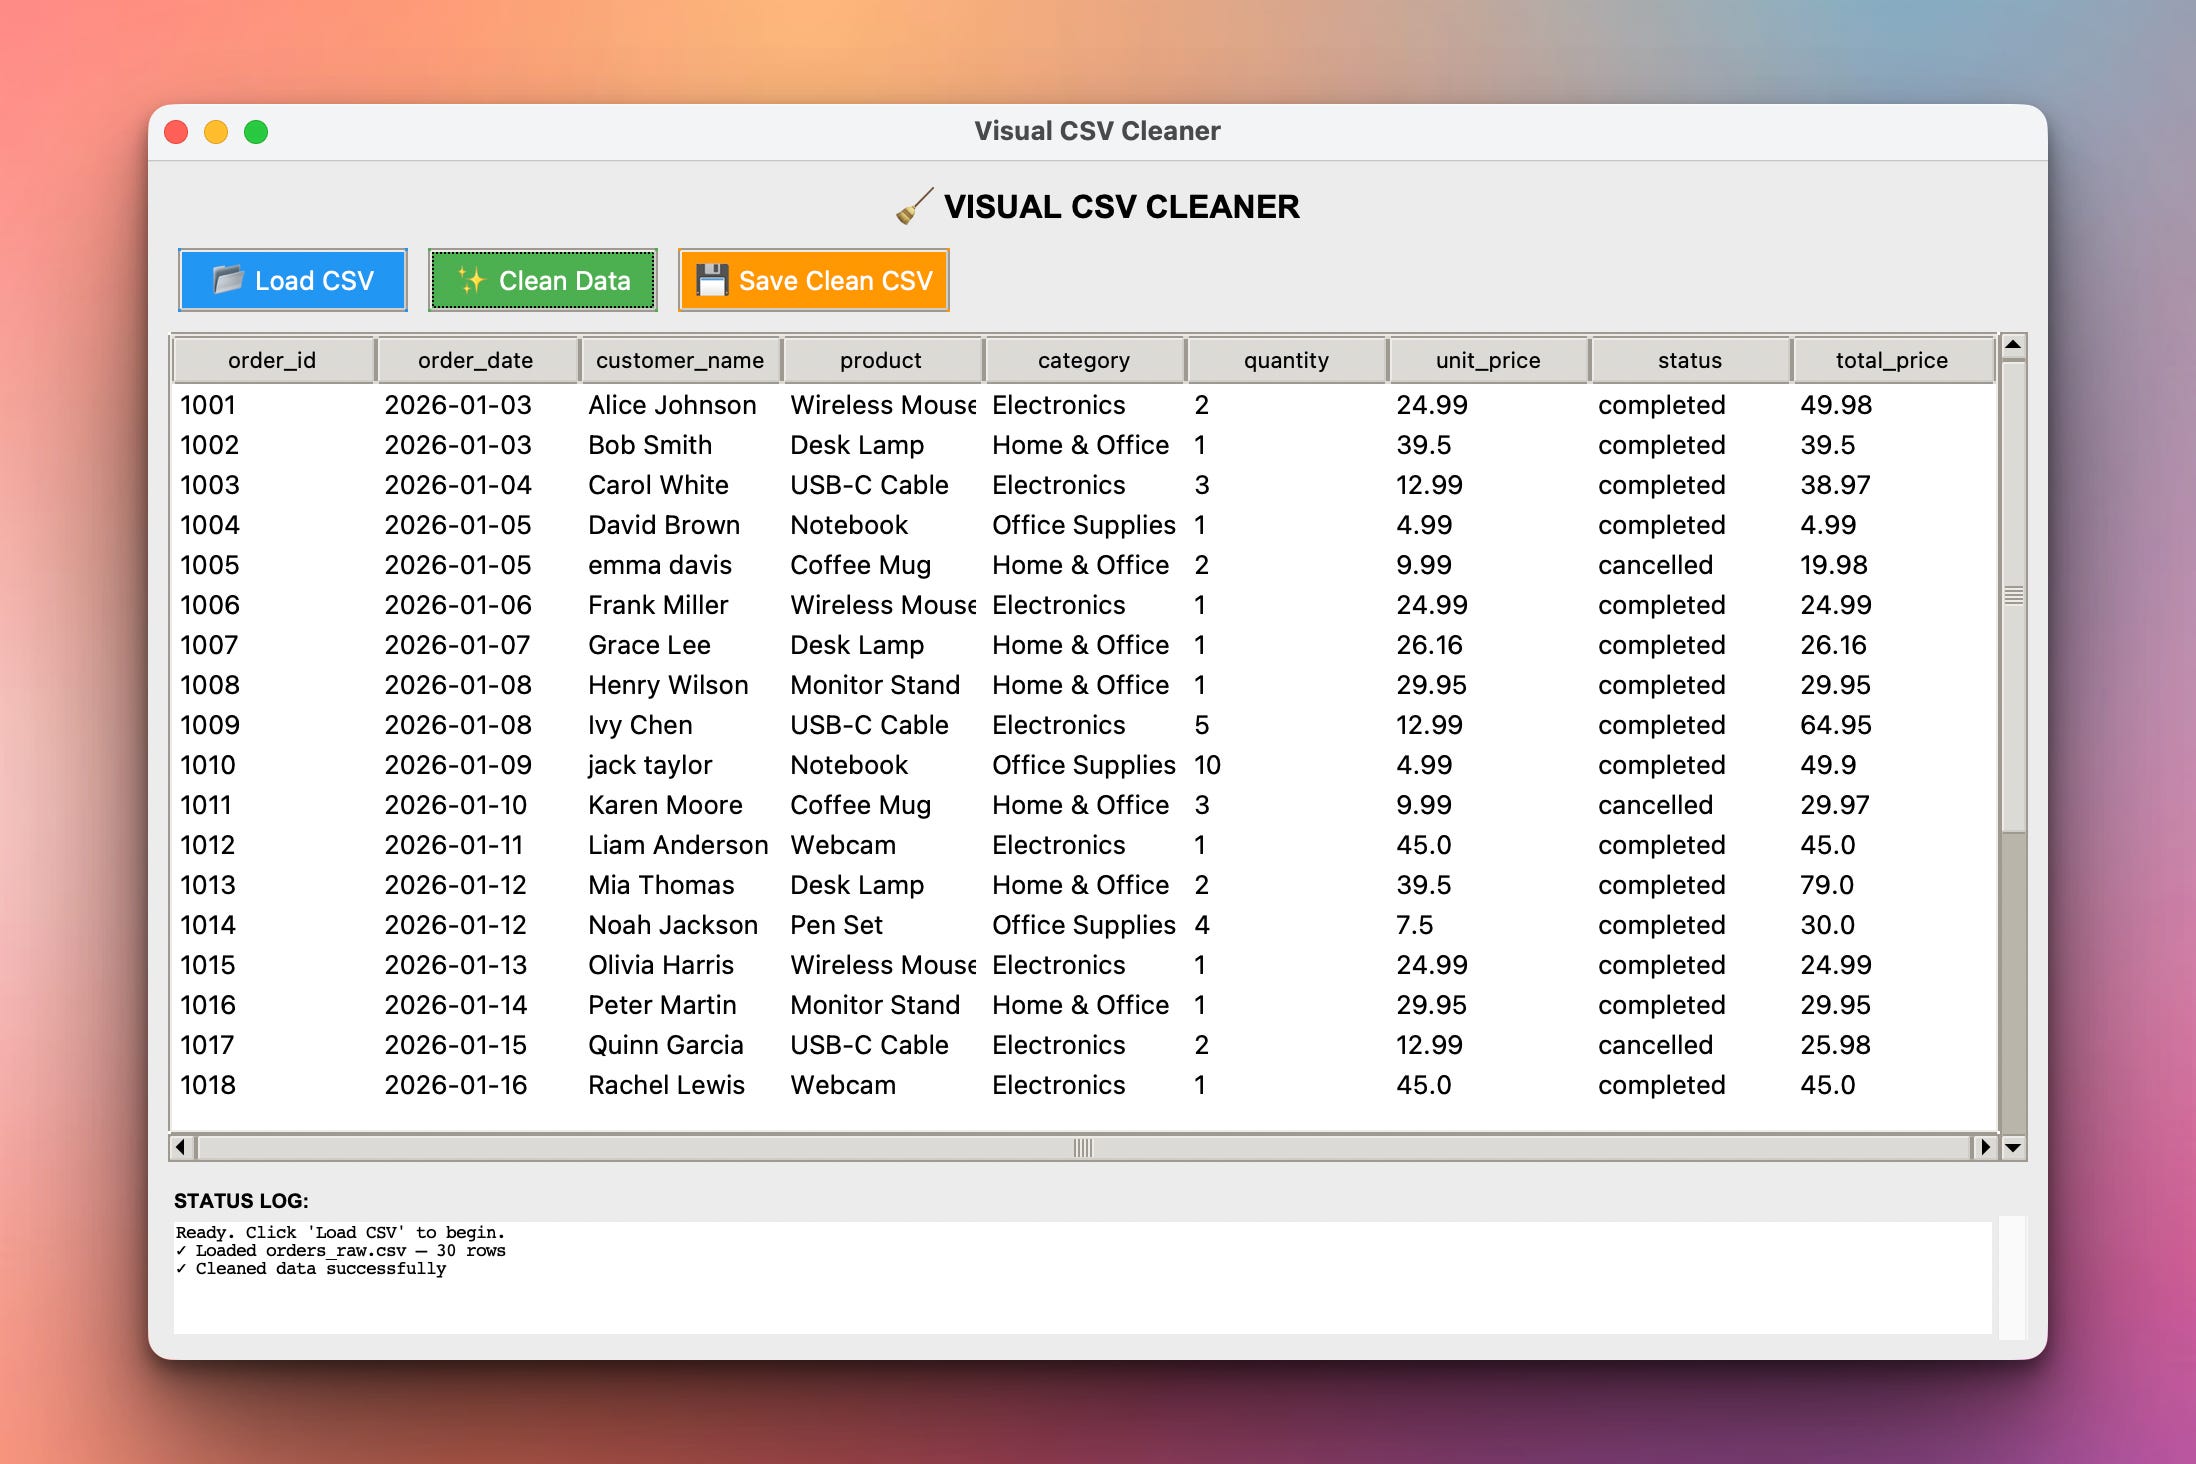
Watch the table change in place: electronics becomes Electronics, $12.99 becomes 12.99, the empty quantity in row 1004 fills with 1, and a new total_price column appears.
Setup Instructions
Install pandas:
pip install pandas
Tkinter ships with Python — nothing else to install.
Get the data file:
Download orders_raw.csv (provided with this project) and keep it handy — you’ll load it from inside the app.
Run the .py program:
python csv_cleaner.py
Understanding the Messy Data
Before building anything, look at orders_raw.csv. These are the six problems hiding in it:
Whitespace —
" Alice Johnson"and"Bob Smith "have stray spaces.Inconsistent categories —
Electronics,electronics,ELECTRONICSare the same category spelled three ways.Inconsistent status —
completed,Completed,COMPLETED— same problem.Currency symbols — some prices are
$12.99(text!) instead of12.99(a number).Missing quantities — a few
quantitycells are empty.Missing prices — a few
unit_pricecells are empty.
Each one breaks analysis later. Sum revenue and $12.99 crashes the math. Group by category and you get six groups instead of three. Cleaning is what makes analysis possible.
Understanding the App Structure
We organize the whole app as a class. The class holds the DataFrame as self.df, so every method — load, clean, save — works on the same shared data:
import tkinter as tk
from tkinter import ttk, filedialog
import pandas as pd

class CSVCleanerApp:
    def __init__(self, root):
        self.root = root
        self.df = None          # the DataFrame, shared across all methods
        self.build_ui()

    def build_ui(self):
        # buttons, table, status log go here
        ...
self.df starts as None (nothing loaded yet). load_csv() fills it, clean_data() transforms it, save_csv() writes it out. Storing the data on self is what lets separate button clicks act on one shared dataset.
Understanding the Treeview Table
Tkinter’s ttk.Treeview is the widget for showing tabular data — rows and columns, like a spreadsheet:
# Create the table
self.tree = ttk.Treeview(self.root, show="headings")

# Define which columns exist
self.tree["columns"] = ("order_id", "customer_name", "product")

# Set the header text for each column
for col in self.tree["columns"]:
    self.tree.heading(col, text=col)
    self.tree.column(col, width=120)

# Add a row of data
self.tree.insert("", "end", values=(1001, "Alice Johnson", "Wireless Mouse"))
Three ideas:
show="headings"hides Treeview’s default empty first column — you almost always want this..heading()sets the visible column title;.column()sets its width..insert("", "end", values=(...))adds one row; the tuple of values fills the columns left to right.
Understanding Displaying a DataFrame
The table widget doesn’t know about pandas — so we need a function that takes any DataFrame and renders it into the Treeview. The pattern is: clear the table, set up the columns, then add every row.
def show_dataframe(self, df):
    # 1. Clear any existing rows
    self.tree.delete(*self.tree.get_children())

    # 2. Set the columns to match the DataFrame
    self.tree["columns"] = list(df.columns)
    for col in df.columns:
        self.tree.heading(col, text=col)
        self.tree.column(col, width=110)

    # 3. Add every row from the DataFrame
    for _, row in df.iterrows():
        self.tree.insert("", "end", values=list(row))
This one function is reused for both the before and after views. Load the messy data — call show_dataframe. Clean it — call show_dataframe again. The table just re-renders whatever DataFrame you hand it.
Understanding Loading a File
The “Load CSV” button opens a file picker with filedialog, then reads the chosen file:
from tkinter import filedialog

def load_csv(self):
    path = filedialog.askopenfilename(
        title="Select a CSV file",
        filetypes=[("CSV files", "*.csv")]
    )
    if not path:          # user clicked Cancel
        return

    self.df = pd.read_csv(path)
    self.show_dataframe(self.df)
    self.log(f"Loaded {path} — {len(self.df)} rows, {len(self.df.columns)} columns")
filedialog.askopenfilename returns the selected path as a string — or an empty string if the user cancels, which is why we check if not path. Once loaded, we show the data and log what happened.
Understanding the Cleaning Pipeline
The cleaning logic is pure pandas — the same regardless of GUI or CLI. We break it into one method per problem, all called by clean_data():
def clean_data(self):
    if self.df is None:
        self.log("Load a CSV first!")
        return

    df = self.df

    # --- Strip whitespace from text columns ---
    text_cols = ["customer_name", "product", "category", "status"]
    for col in text_cols:
        df[col] = df[col].astype(str).str.strip()

    # --- Standardize capitalization ---
    df["category"] = df["category"].str.title()   # electronics -> Electronics
    df["status"] = df["status"].str.lower()        # COMPLETED -> completed

    # --- Fix the price column ---
    df["unit_price"] = df["unit_price"].astype(str).str.replace("$", "", regex=False)
    df["unit_price"] = pd.to_numeric(df["unit_price"], errors="coerce")

    # ... (quantity, missing values, total_price) ...

    self.df = df
    self.show_dataframe(self.df)
The key tools:
.str.strip()/.str.title()/.str.lower()— string operations applied to a whole column via the.straccessor..str.replace("$", "", regex=False)— strips the dollar sign so the text can become a number.pd.to_numeric(..., errors="coerce")— converts text to numbers; anything unconvertible becomesNaN(missing) instead of crashing.
Understanding Missing Value Handling
After converting types, some cells are missing. For sales data we fill rather than drop — dropping rows loses real orders.
Missing quantity → fill with 1 (an order existed, so at least one item):
df["quantity"] = pd.to_numeric(df["quantity"], errors="coerce")
df["quantity"] = df["quantity"].fillna(1).astype(int)
Missing unit_price → fill with that category’s average price (a flat number would distort things — a missing webcam price shouldn’t become $5):
category_avg = df.groupby("category")["unit_price"].transform("mean")
df["unit_price"] = df["unit_price"].fillna(category_avg).round(2)
groupby(...).transform("mean") computes each category’s average and aligns it to every row, so each gap is filled with its own category’s average. “Handle missing values” always means think about what the right value is.
Understanding the Calculated Column
Clean, properly-typed data lets you derive new information. Total price is just quantity × unit price — one line, now that both columns are real numbers:
df["total_price"] = (df["quantity"] * df["unit_price"]).round(2)
This is the payoff of cleaning. If unit_price were still text with dollar signs, this multiplication would fail outright.
Understanding the Status Log
A good tool tells the user what it did. We add a scrolling text box at the bottom and append a line for each action:
from tkinter import scrolledtext

# In build_ui:
self.status_log = scrolledtext.ScrolledText(self.root, height=6)

def log(self, message):
    self.status_log.insert(tk.END, message + "\n")
    self.status_log.see(tk.END)   # auto-scroll to the newest line
Each cleaning step calls self.log(...). The user gets a running history — “stripped whitespace,” “filled 3 missing quantities” — instead of changes happening invisibly.
Understanding Saving the Result
The “Save Clean CSV” button uses a save dialog and writes the DataFrame out:
def save_csv(self):
    if self.df is None:
        self.log("Nothing to save — load and clean a file first.")
        return

    path = filedialog.asksaveasfilename(
        defaultextension=".csv",
        filetypes=[("CSV files", "*.csv")]
    )
    if not path:
        return

    self.df.to_csv(path, index=False)
    self.log(f"Saved clean data to {path}")
asksaveasfilename lets the user choose where to save. index=False in to_csv is important — without it, pandas writes its internal row numbers as a junk extra column.
Practical Use Cases
1. Cleaning exported reports:
E-commerce, accounting, and CRM exports are notoriously messy — clean them on arrival.
2. A reusable cleaning tool:
Build it once, then clean any sales CSV by loading it into the app.
3. Visual data inspection:
Seeing the table before and after catches problems a script would hide.
4. Non-technical users:
A GUI means colleagues can clean data without touching code.
5. Foundation for Day 2:
Tomorrow's analyzer needs clean, typed data — this app produces exactly that.Coming Tomorrow
Tomorrow we put the clean data to work. The Sales Analyzer takes orders_clean.csv and computes real business insights — revenue by category, best-selling products, daily trends, average order value — and generates a formatted summary report.
Skeleton and Solution
Below you will find both a downloadable skeleton.py file to help you code the project with comment guides and the downloadable solution.py file containing the correct solution.
Get the code skeleton here:
Get the code solution here: