

Build a Grade Calculator with a Web Interface with Data Visualization
Level: Real World

We’ve come so far this week working of different versions of the grade calculator app while making it more advanced every day.
Today we’re bringing it all together with a beautiful web interface and visual charts — transforming our console app into a professional web application!
This Project’s Journey so far:
Here is what we built the previous days:
Day 1: Basic calculator using functions ✓
Day 2: Refactor with classes for better organization ✓
Day 3: Add inheritance with Student and Teacher classes ✓
Day 4 (Today): Create a web interface with data visualization
Previous Day’s Solution (Day 3):
import csv
import os

class Person:
    def __init__(self, name, age):
        self.name = name
        self.age = age

    def display_info(self):
        print(f"Name: {self.name}")
        print(f"Age: {self.age}")

class Student(Person):
    def __init__(self, name, age, scores):
        super().__init__(name, age)
        self.scores = scores

    def calculate_average(self):
        return sum(self.scores) / len(self.scores)

    def get_letter_grade(self):
        score = self.calculate_average()
        if score >= 90:
            return "A"
        elif score >= 80:
            return "B"
        elif score >= 70:
            return "C"
        elif score >= 60:
            return "D"
        else:
            return "F"

    def get_status(self):
        return "PASS" if self.calculate_average() >= 60 else "FAIL"

def save_student(student):
    file_exists = os.path.exists('students.csv')
    with open('students.csv', 'a', newline='') as f:
        writer = csv.writer(f)
        if not file_exists:
            writer.writerow(['Name', 'Age', 'Scores', 'Average', 'Grade', 'Status'])
        writer.writerow([
            student.name,
            student.age,
            ','.join(map(str, student.scores)),
            f"{student.calculate_average():.1f}",
            student.get_letter_grade(),
            student.get_status()
        ])

def load_students():
    if not os.path.exists('students.csv'):
        return []
    students = []
    with open('students.csv', 'r') as f:
        reader = csv.DictReader(f)
        for row in reader:
            scores = [int(s) for s in row['Scores'].split(',')]
            student = Student(row['Name'], int(row['Age']), scores)
            students.append(student)
    return students

print("Grade Management System with CSV Storage")
print("=" * 40)

while True:
    print("\n1. Add Student")
    print("2. View All Students")
    print("3. Exit")
    choice = input("\nChoice: ")

    if choice == '1':
        name = input("Student name: ")
        age = int(input("Age: "))
        scores_input = input("Test scores (comma-separated): ")
        scores = [int(s.strip()) for s in scores_input.split(',')]
        student = Student(name, age, scores)
        save_student(student)
        print(f"\n✓ {name} added successfully!")

    elif choice == '2':
        students = load_students()
        if students:
            print(f"\n{'Name':<20} {'Age':<5} {'Average':<8} {'Grade':<6} {'Status'}")
            print("-" * 50)
            for s in students:
                print(f"{s.name:<20} {s.age:<5} {s.calculate_average():<8.1f} {s.get_letter_grade():<6} {s.get_status()}")
        else:
            print("\nNo students found.")

    elif choice == '3':
        print("\nGoodbye!")
        break
Today’s Project: Streamlit Web Interface with Charts
Today we’re taking our grade calculator to the web! We’ll build a beautiful interface with Streamlit that lets you add students, view all records, and see visual analytics with charts showing grade distribution and performance trends.
Project Task
Create a web-based grade calculator that:
Uses Streamlit to create an interactive web interface
Displays an input form to add new students
Shows all students in a formatted table
Reads from and writes to the CSV file from Day 4
Generates a pie chart showing grade distribution (A, B, C, D, F)
Creates a bar chart showing average scores comparison
Calculates and displays class statistics (average, highest, lowest)
Uses our Student class with inheritance from previous days
This project gives you hands-on practice with web development, data visualization, UI design, and bringing together everything you’ve learned this week — essential skills for building real-world applications.
Expected Output
Here is how the app looks like on the browser:
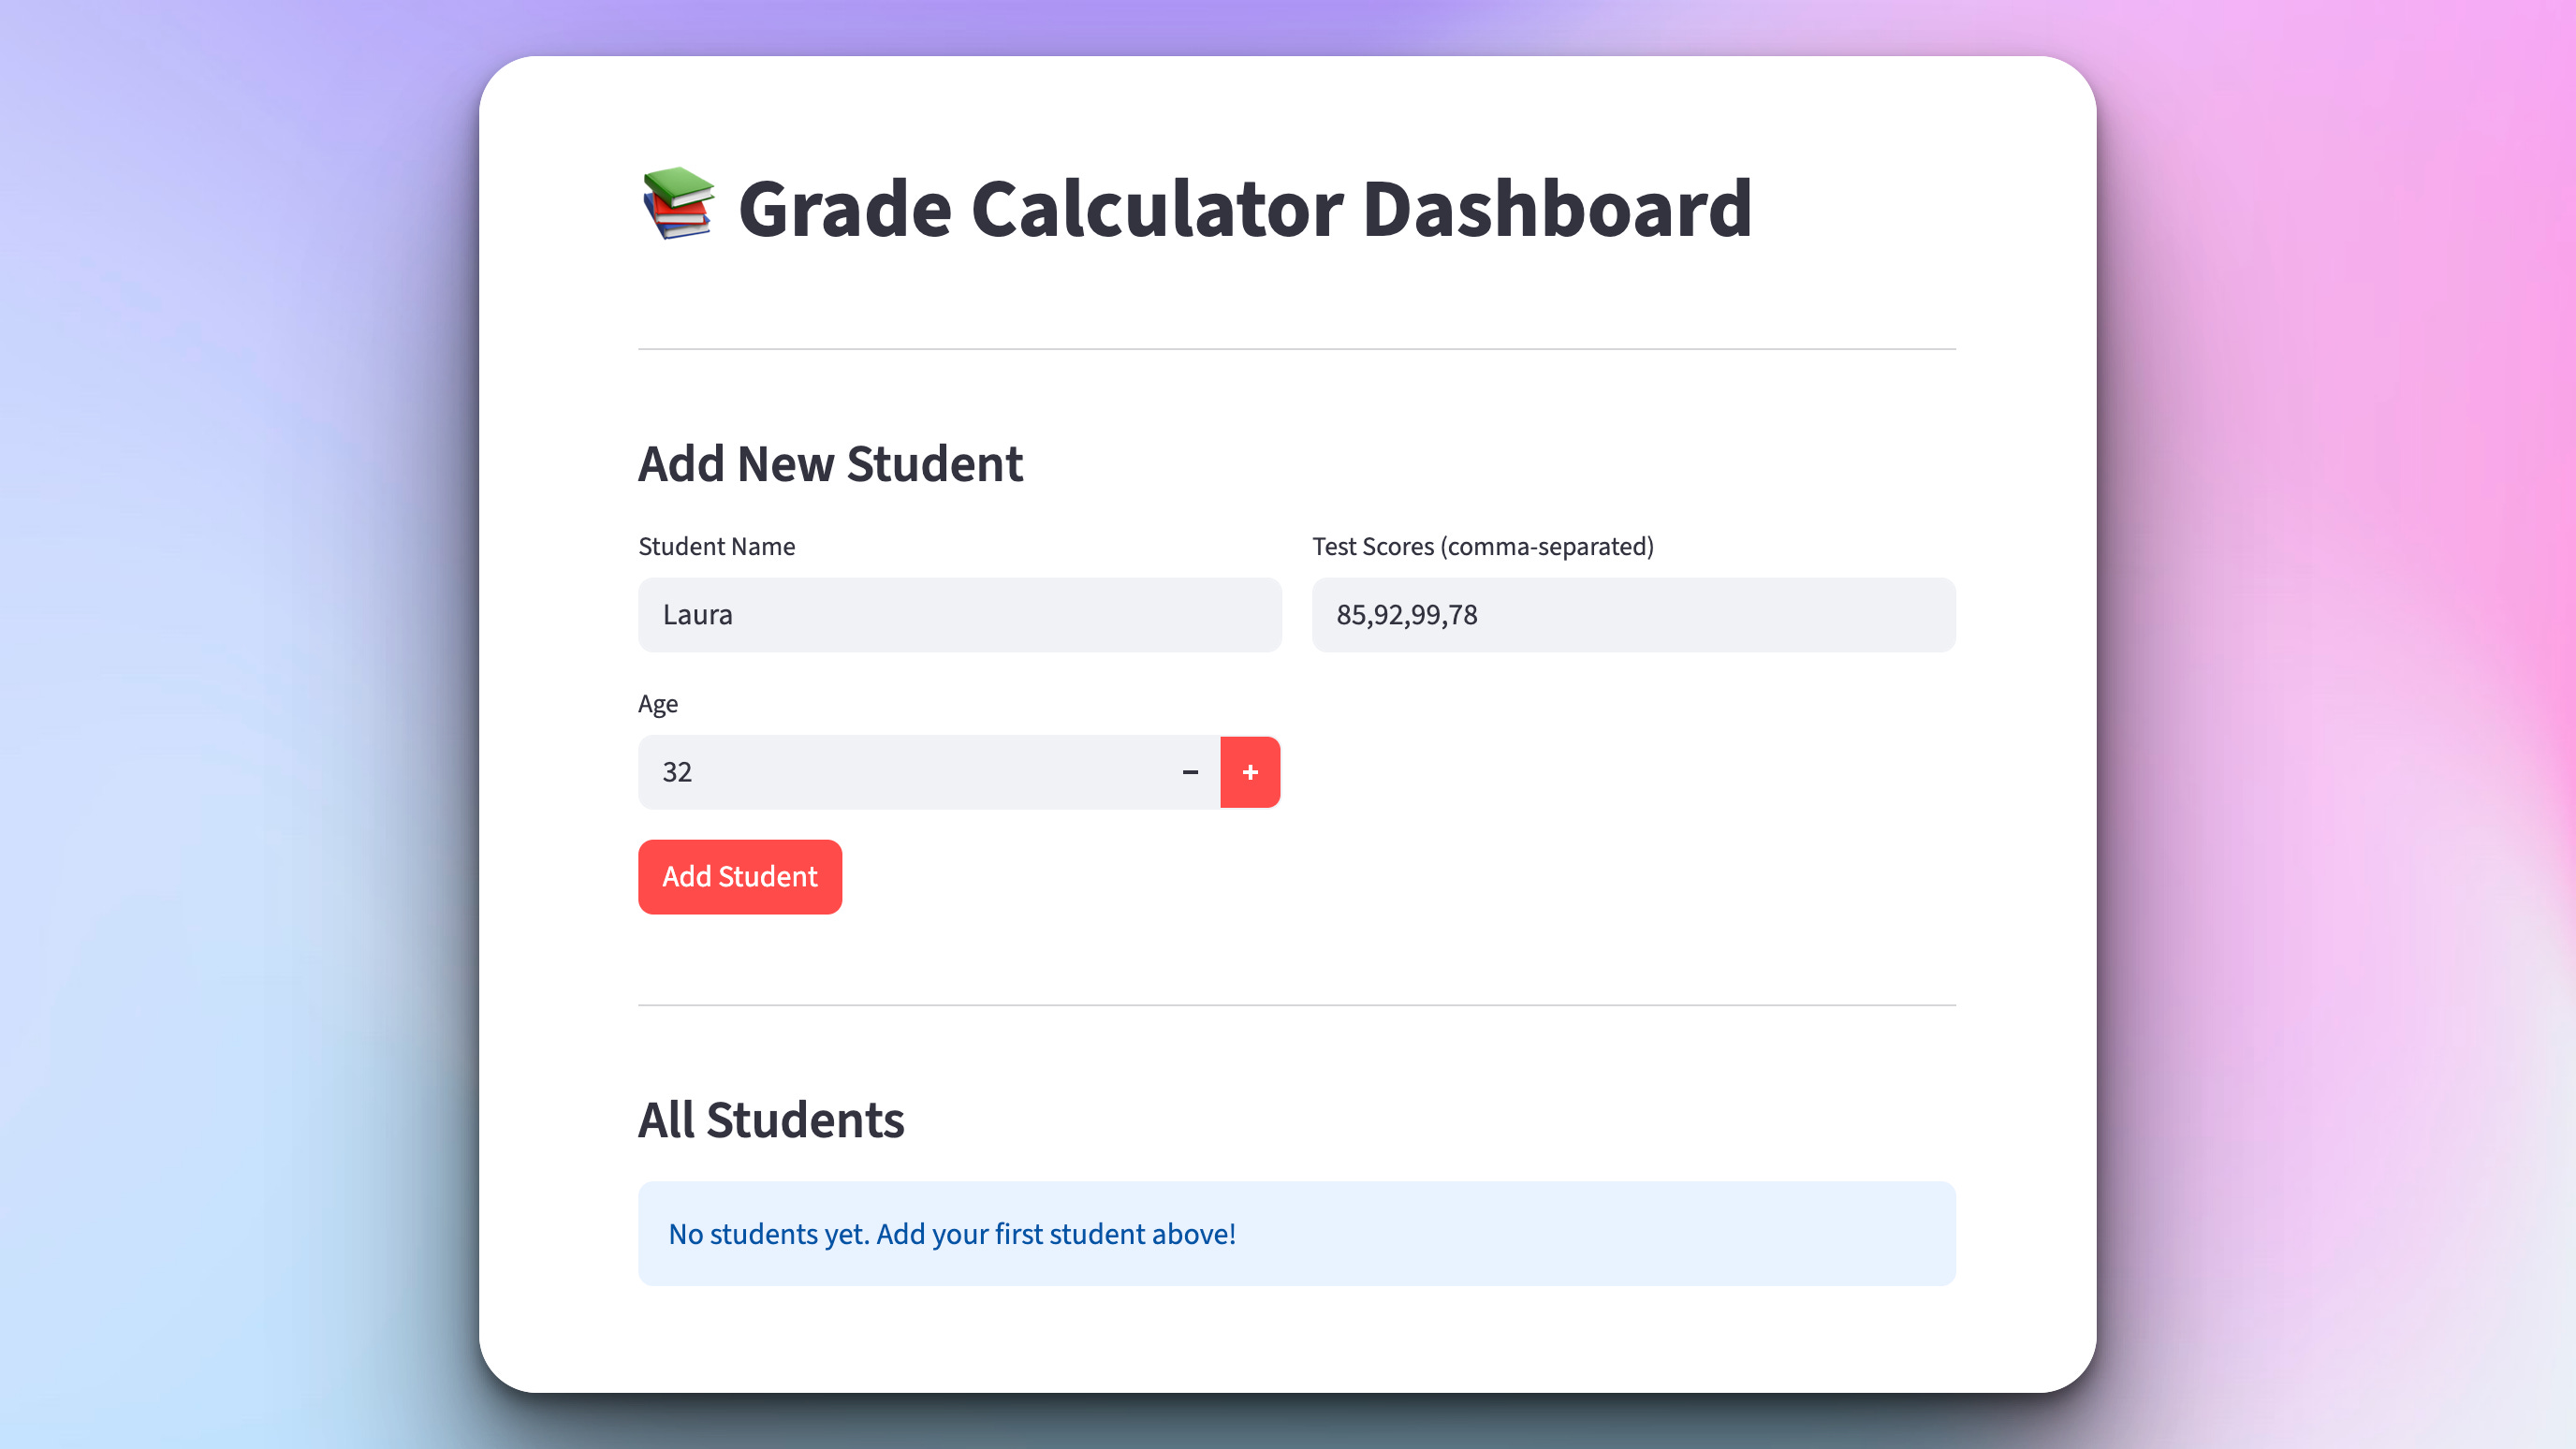
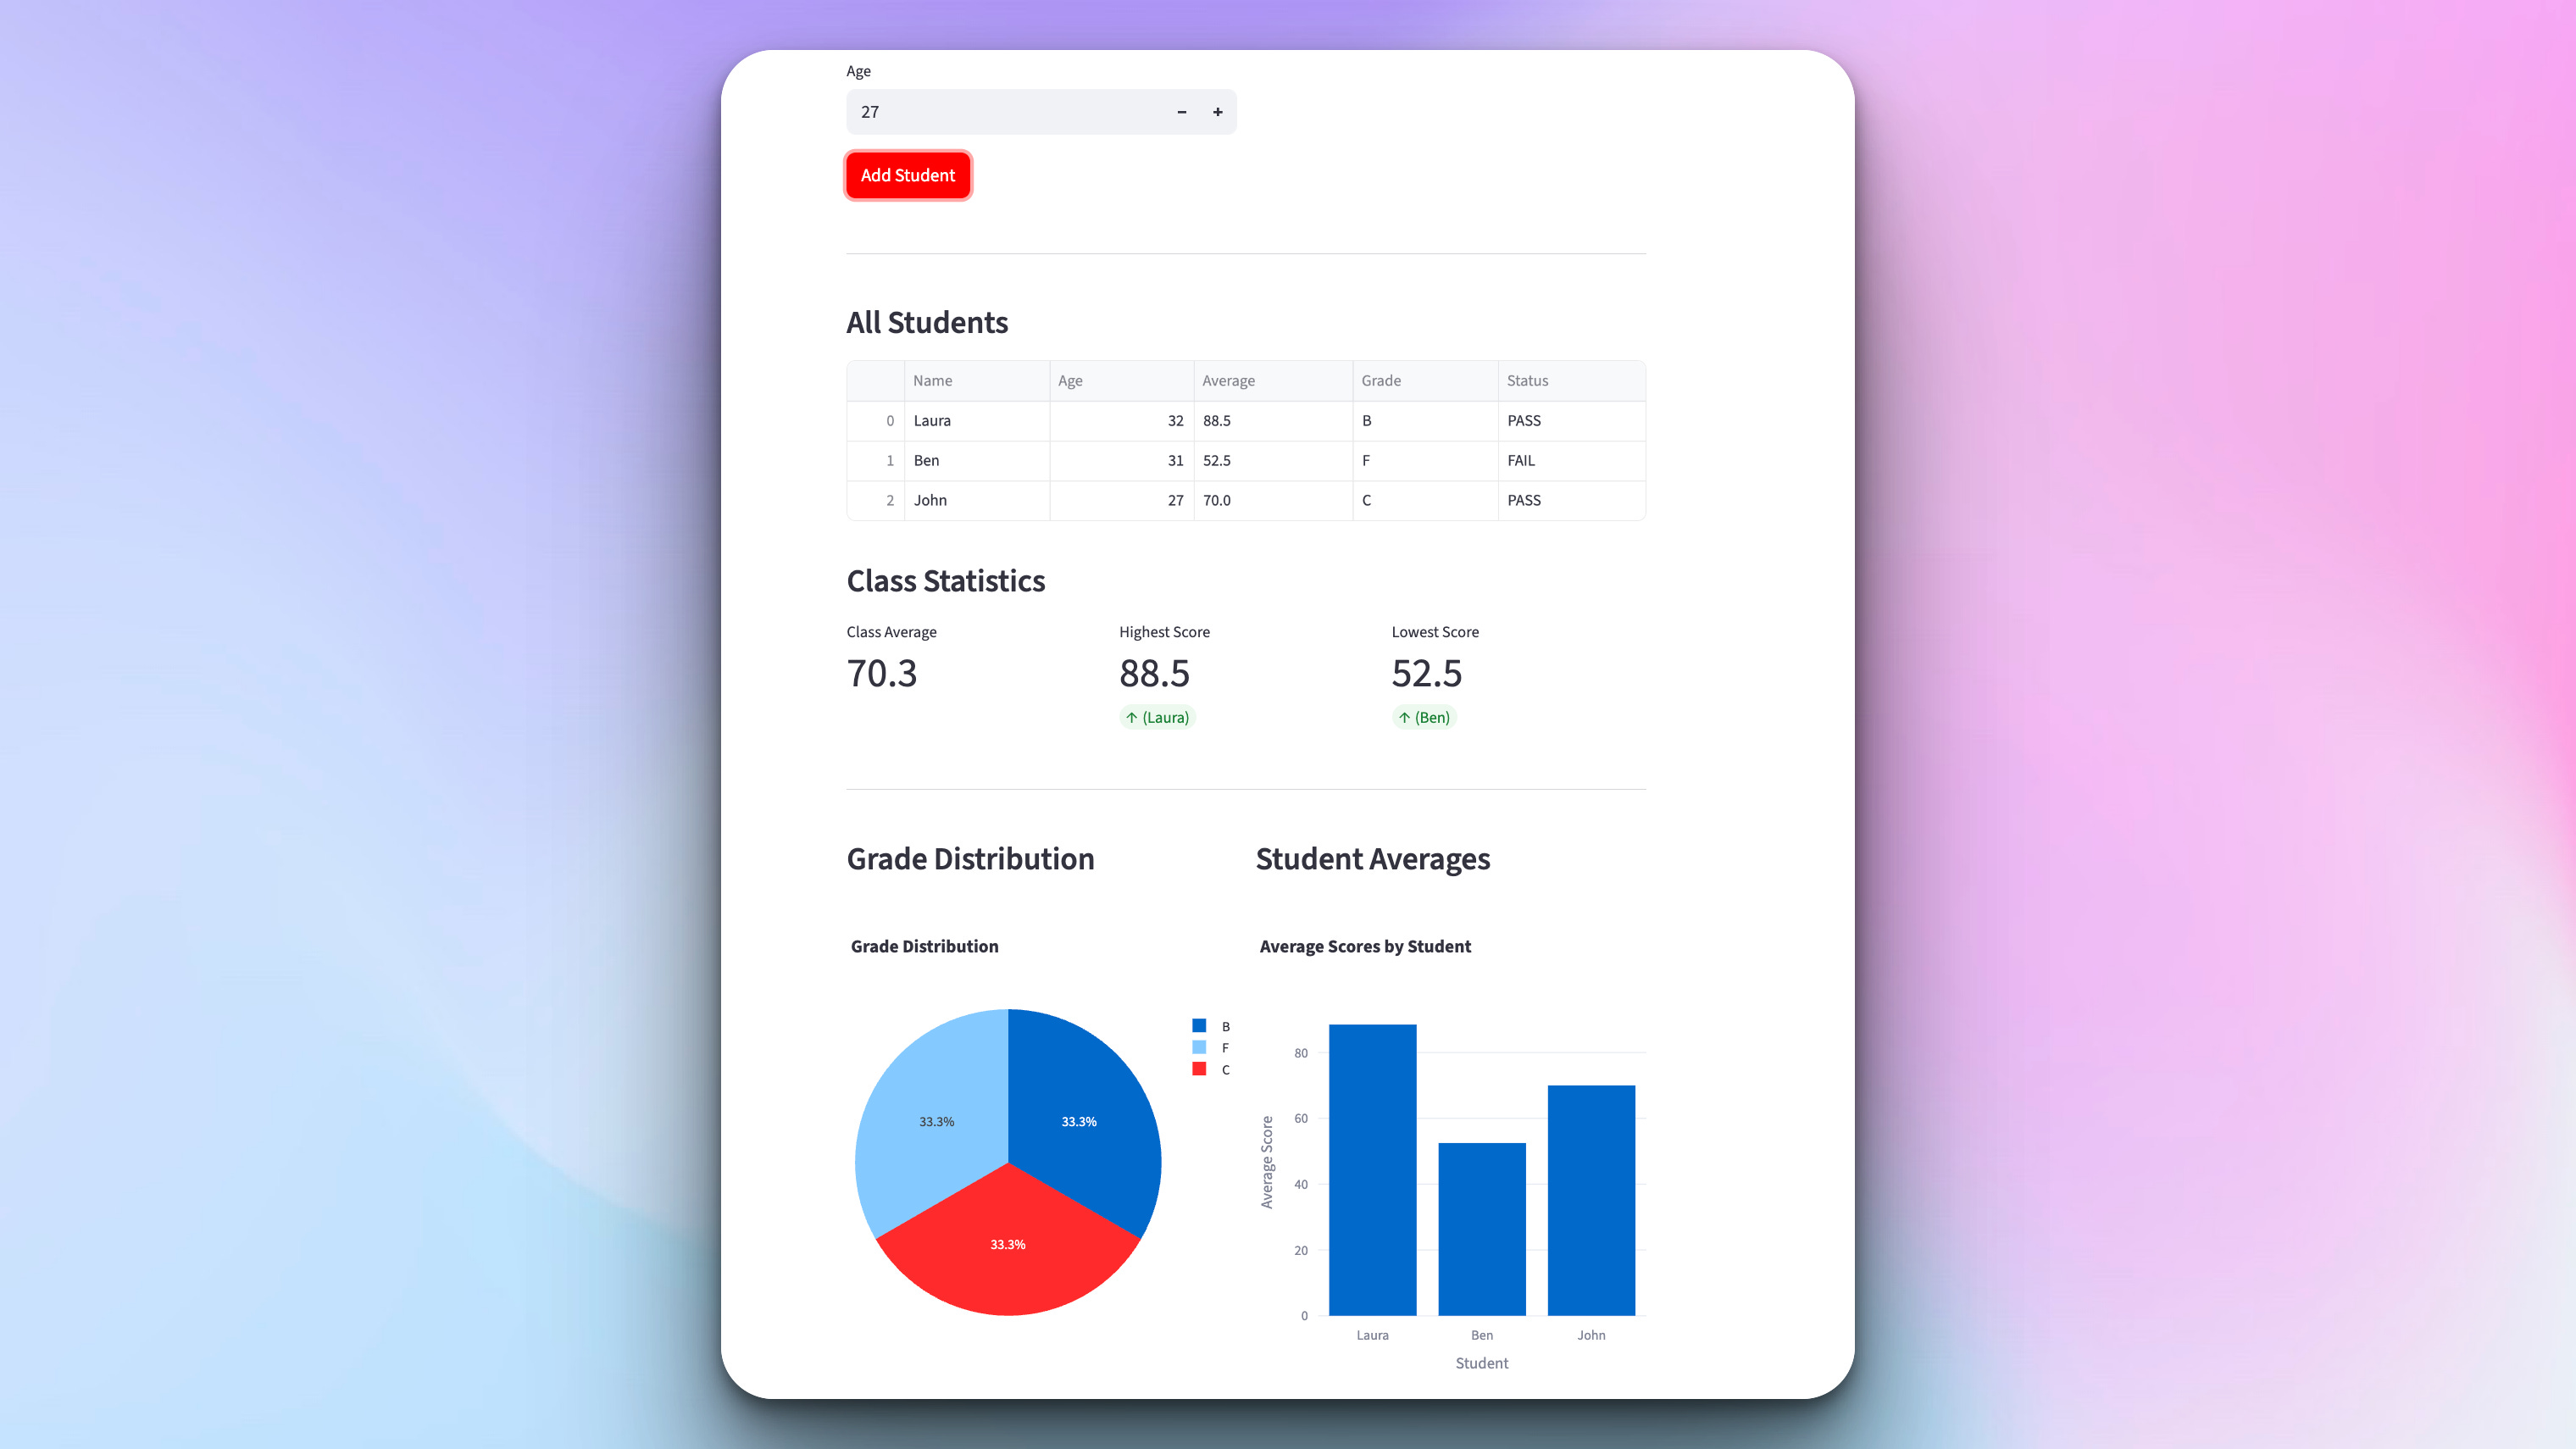
Once the user has submitted a few student records, the dashboard generates several graphs summarizing the submitted data:
Join the Python & AI Builders Skool Community
Got questions to ask the author about this project? Join our Python & AI Builders community for weekly Python & AI videos and discussions:
https://skool.com/automateit
Skeleton and Solution
Below you will find both a downloadable skeleton.py file to help you code the project with comment guides and the downloadable solution.py file containing the correct solution.
Get the code skeleton here:
Keep reading with a 7-day free trial
Subscribe to Daily Python Projects to keep reading this post and get 7 days of free access to the full post archives.