

Build a Weather Data Analytics & Forecasting Tool: Day 1 - Weather Data Collector
Level: Beginner

Projects in this week’s series:
This week, we progressively build a weather data analytics and forecasting tool with Python.
Why build this? Because weather affects everything — travel plans, outdoor activities, business decisions. Instead of just checking today’s weather, you’ll collect and analyze historical patterns, identify trends, and make data-driven forecasts.
What you’ll learn: This series teaches you API integration, time-series data handling, statistical analysis, data visualization, and building analytics pipelines. These skills apply to any data science or analytics project.
Why users love this: Go beyond basic weather apps. Analyze patterns, compare cities, spot trends, and understand what the data actually means — all with your own analytics tool!
Day 1: Weather Data Collector (Today)
Day 2: Weather Data Analysis & Visualization
Day 3: Advanced Analytics & Predictions
Today’s Project
We’re starting with the foundation: we’re creating a tool that collects comprehensive weather data for multiple cities, stores it in CSV format for analysis, and displays current conditions with 7-day forecasts.
You’ll learn how to work with weather APIs, handle time-series data, and build a data collection pipeline that feeds your analytics!
Project Task
Create a weather data collector that:
Fetches current weather for multiple cities
Gets 7-day weather forecasts
Displays temperature, humidity, wind speed, precipitation
Shows weather conditions and descriptions
Saves all data to CSV files for later analysis
Tracks data collection timestamp
Handles multiple API calls efficiently
Formats output in readable tables
This project gives you hands-on practice with weather APIs, data collection pipelines, CSV handling, time-series data, and building the foundation for analytics — essential skills for data science and analysis!
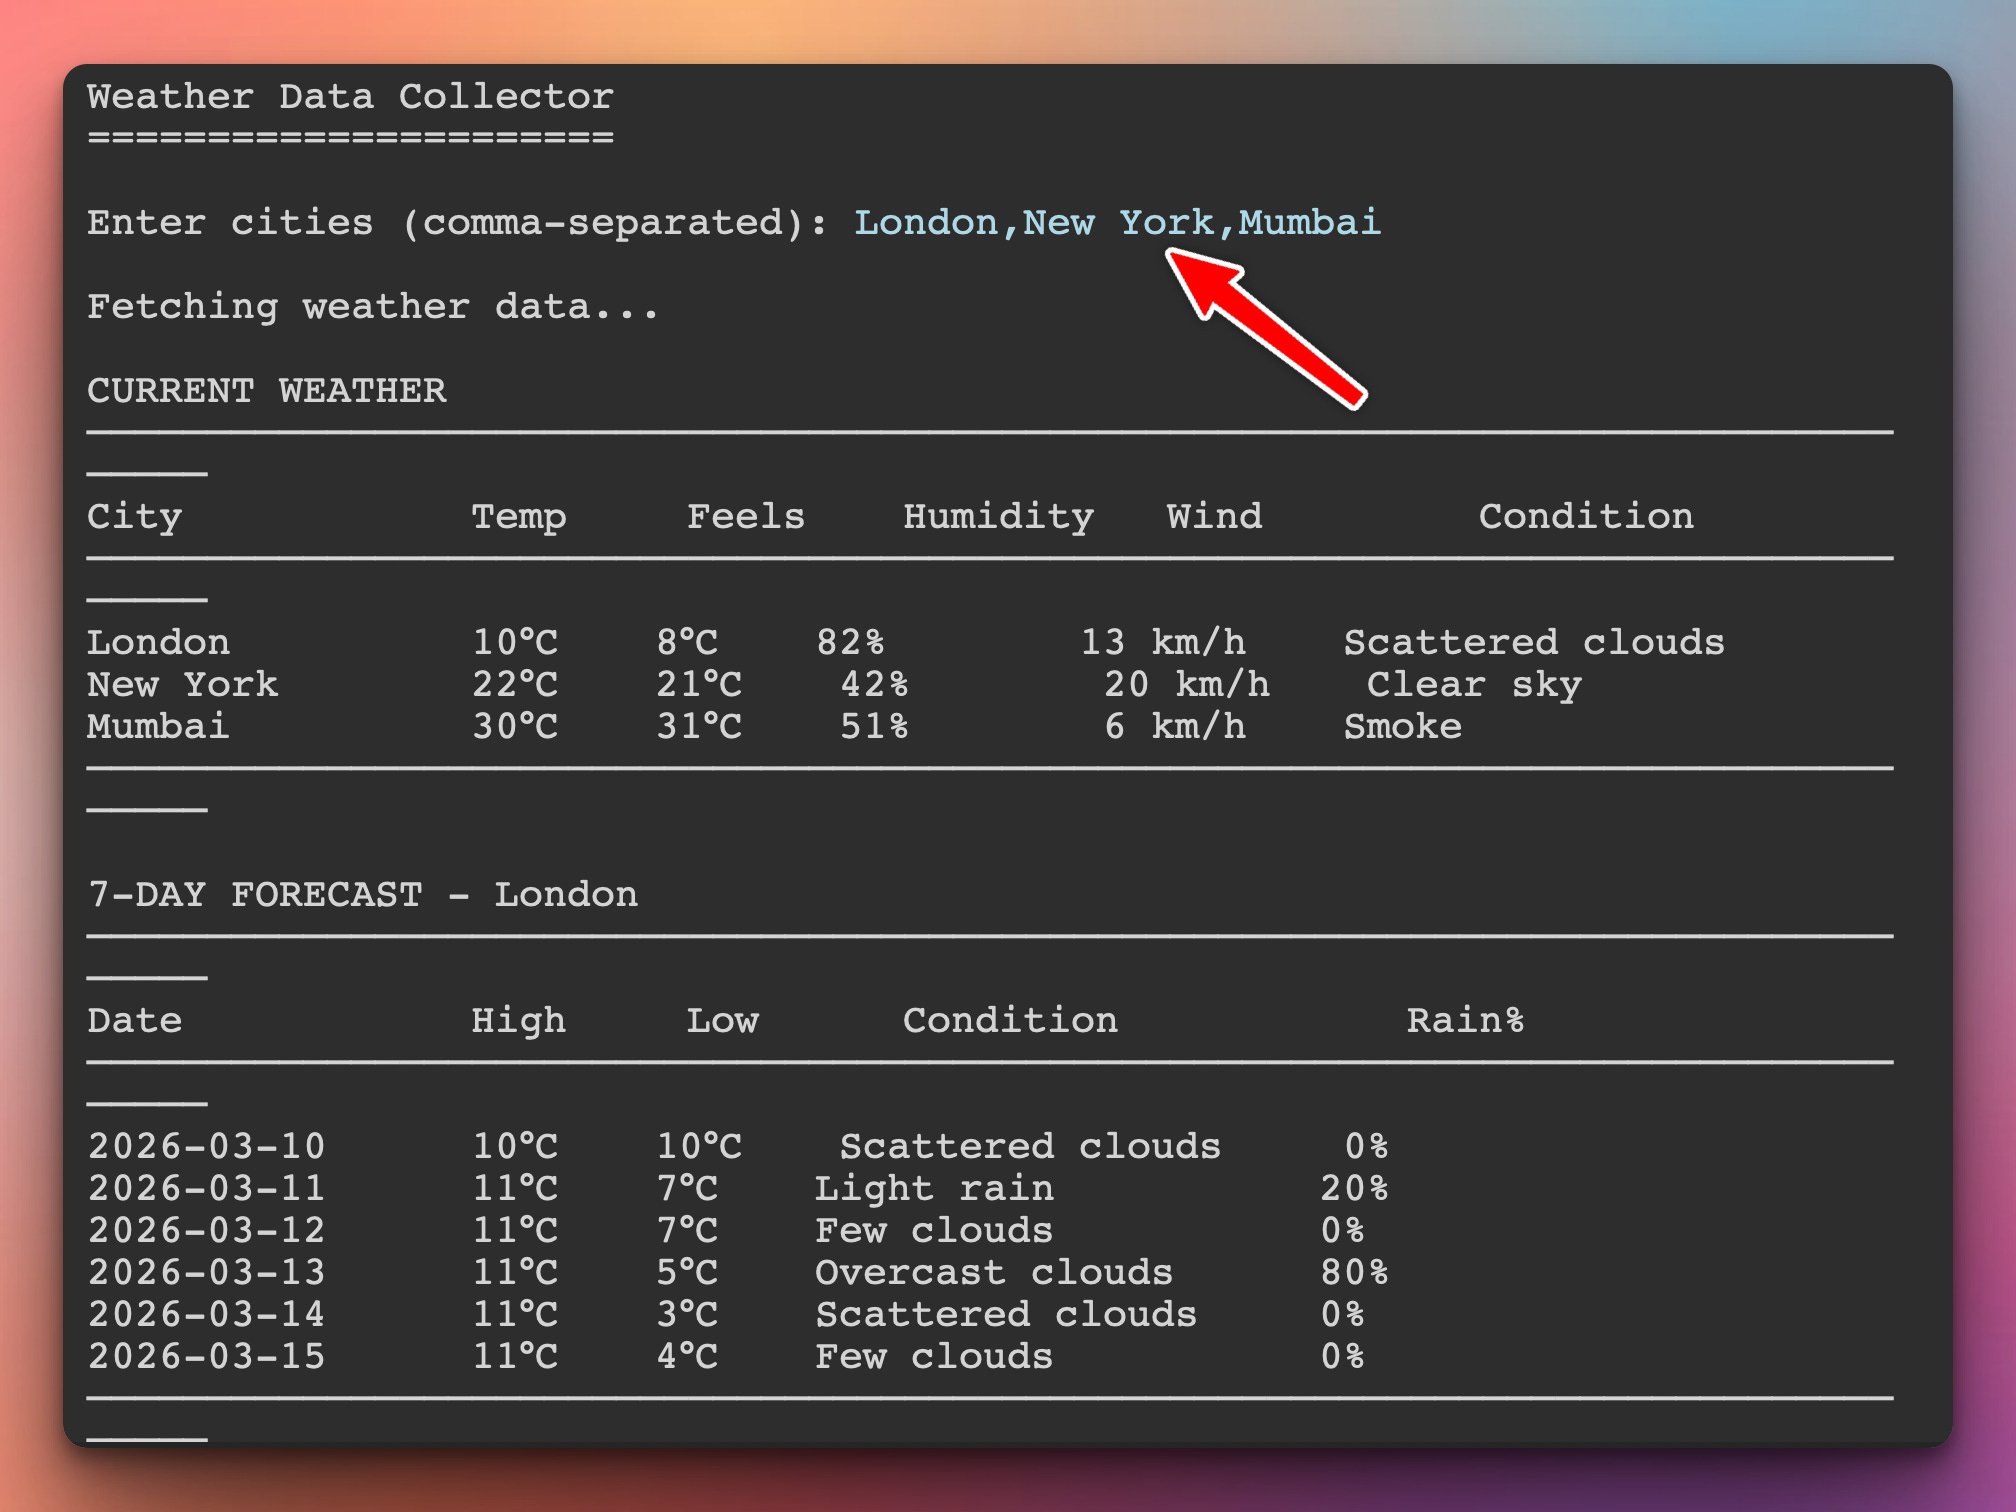
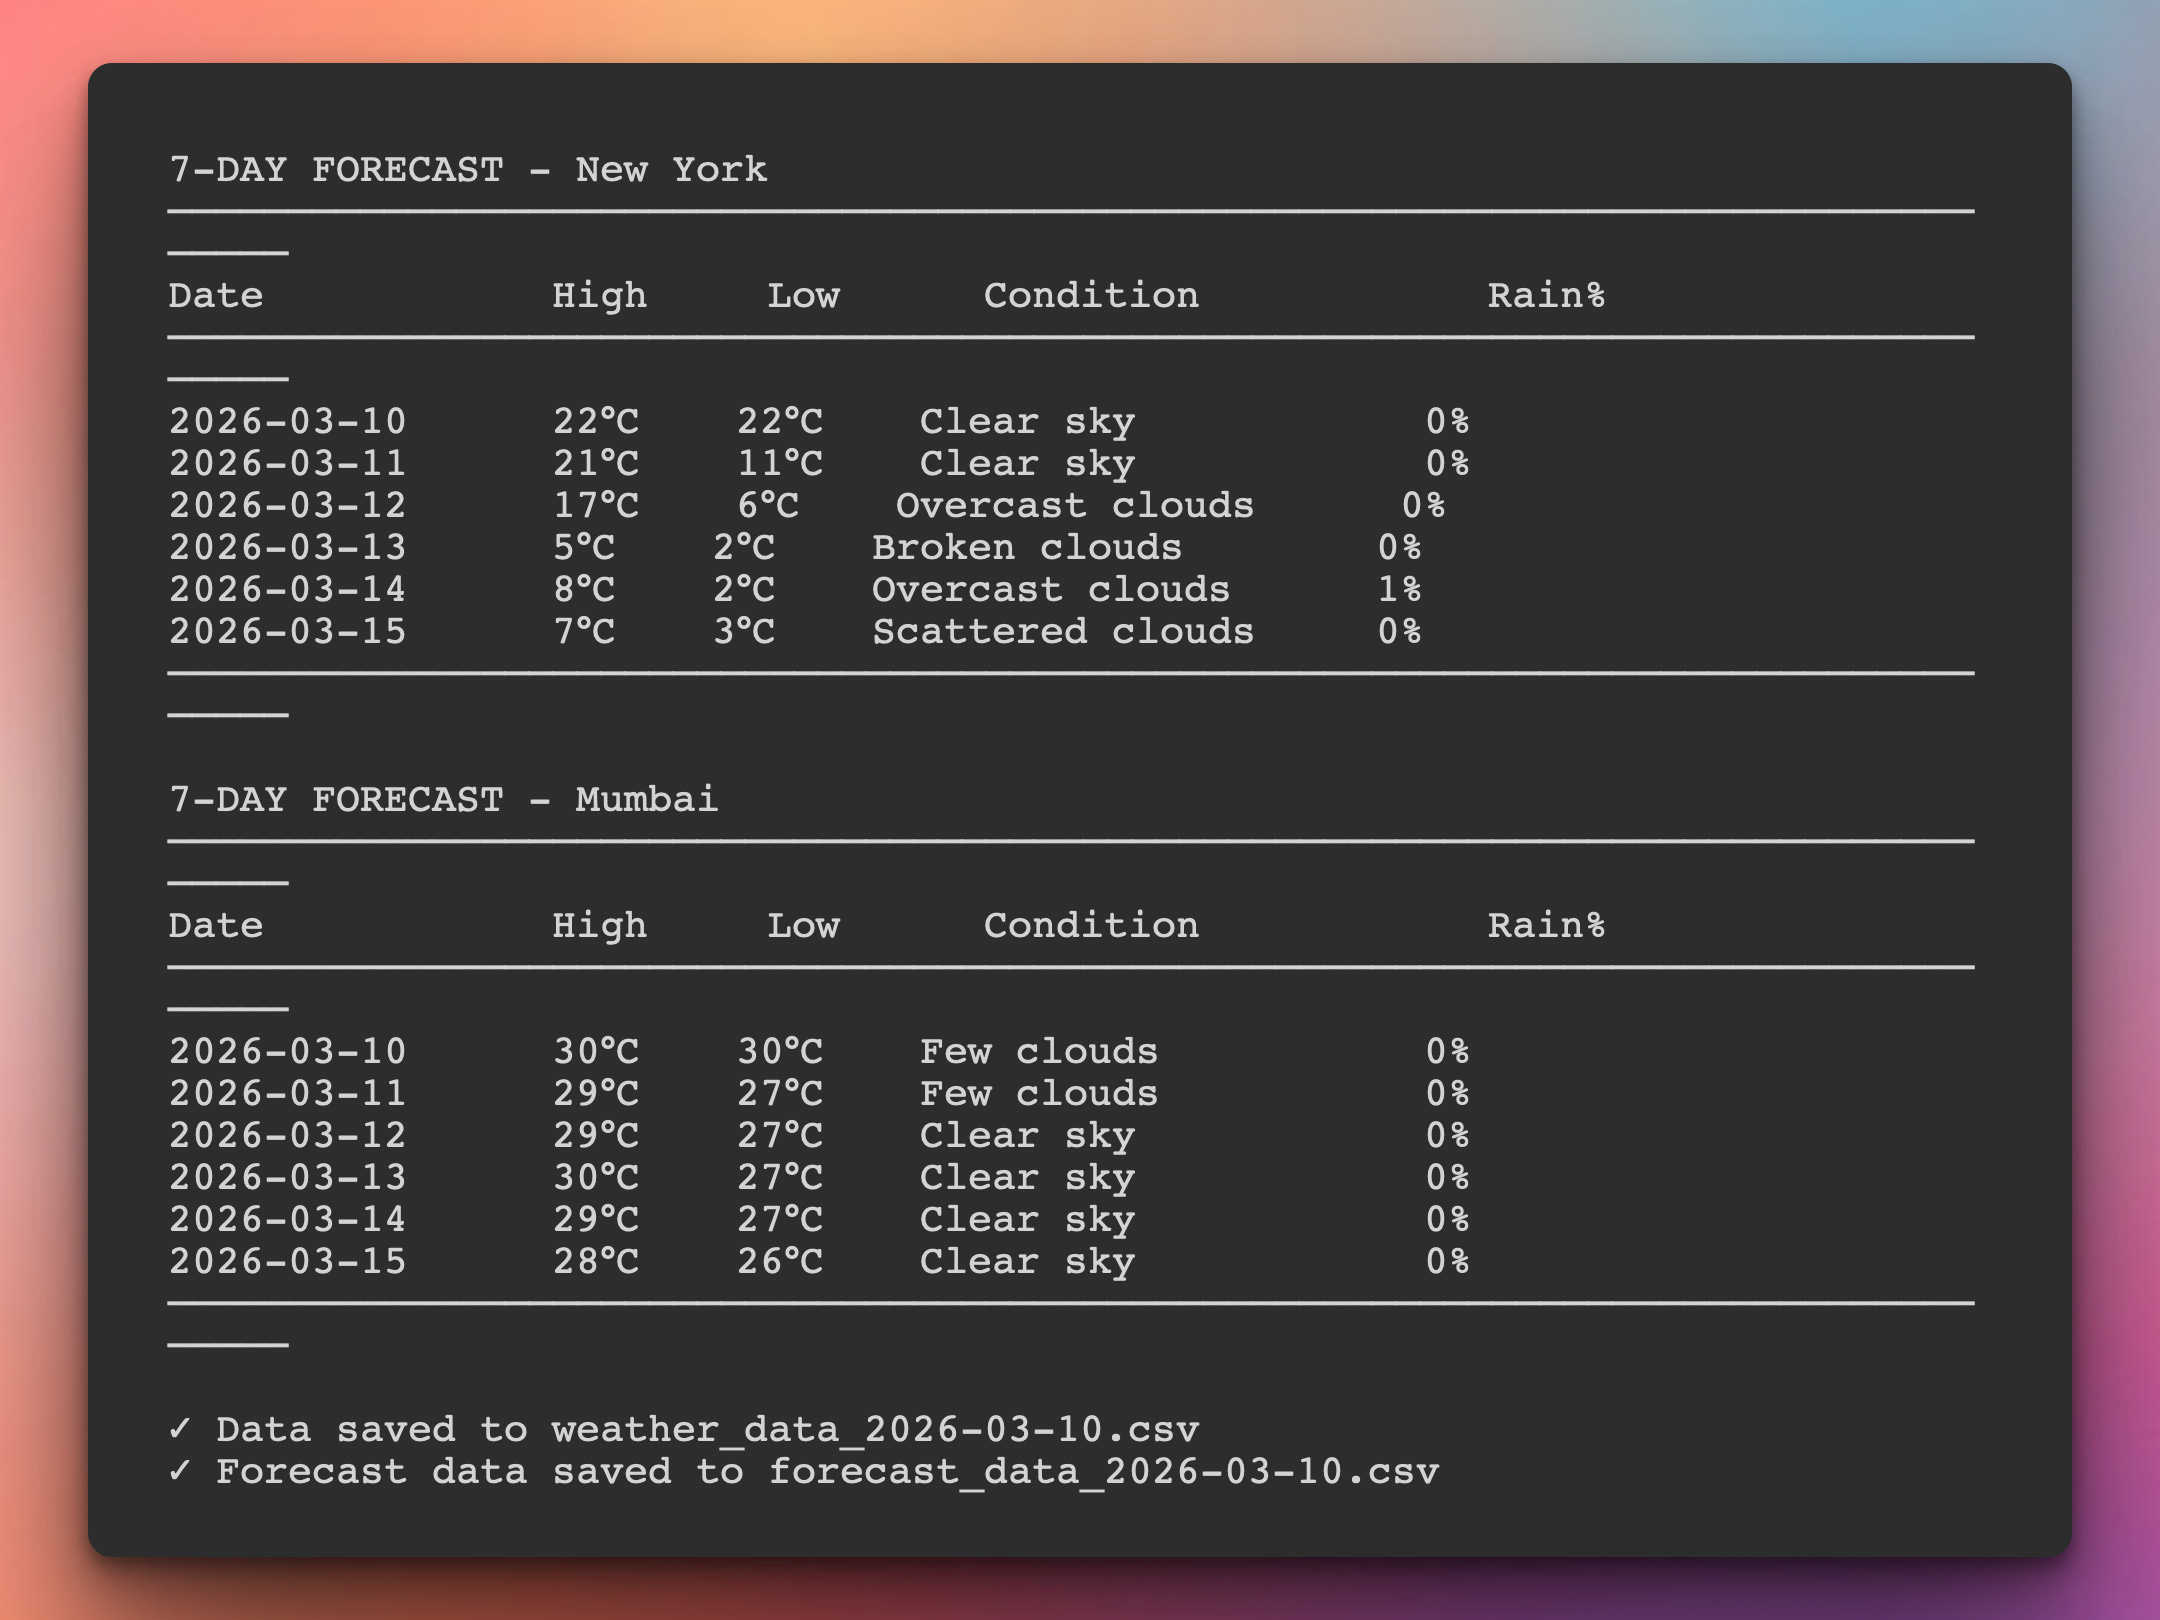
Expected Output
In this first project we will display the data in the command line like below where we have asked for the weather in London, New York, and Mumbai:
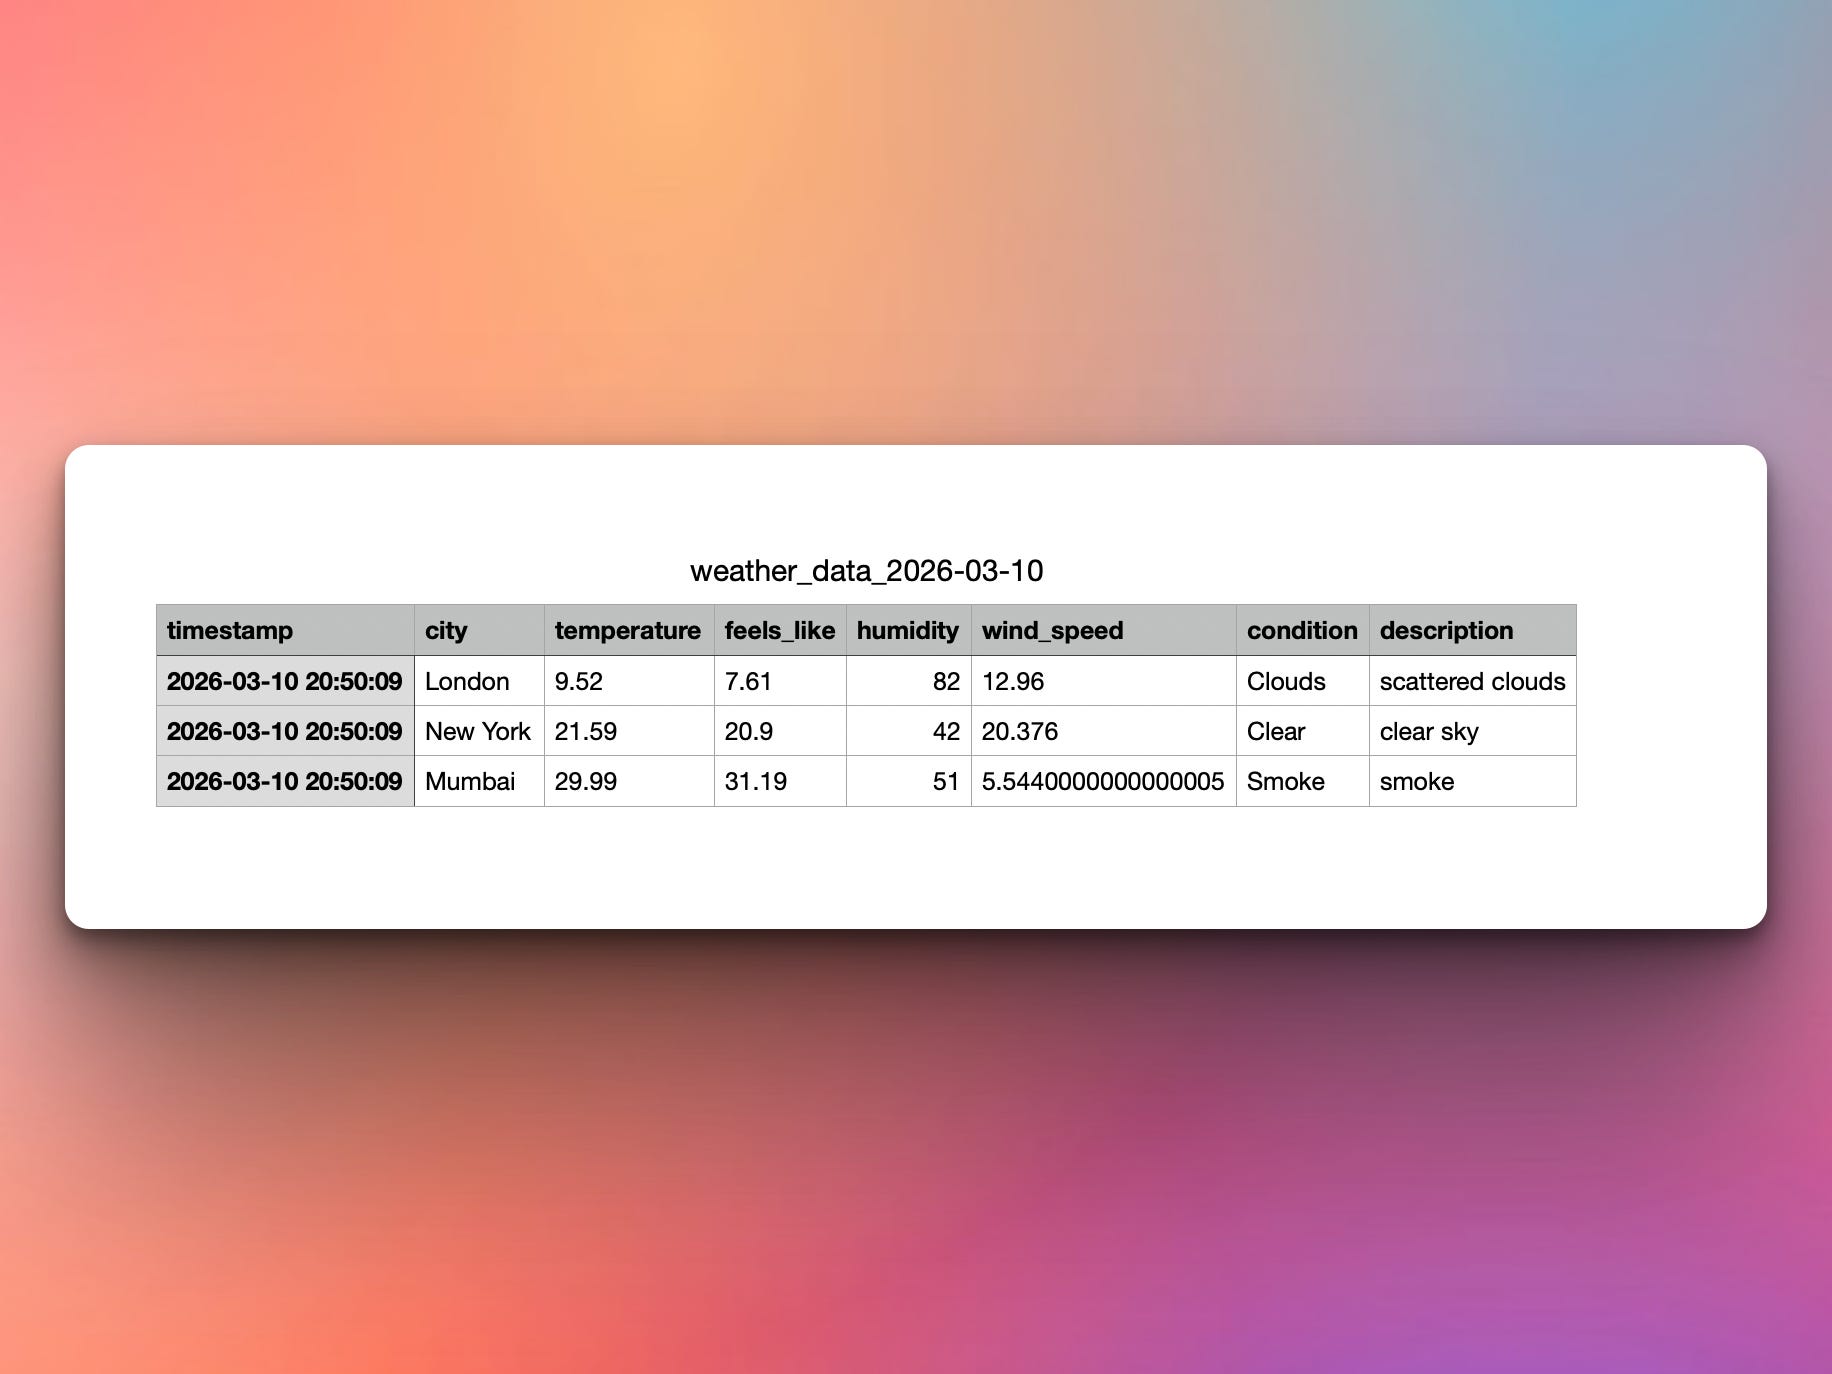
In addition, a CSV file with the data is generated in the local directory:
Setup Instructions
Install required packages:
pip install requests pandasGet Free API Key:
Visit: https://openweathermap.org/api
Sign up for free account
Get API key (free tier: 1000 calls/day)
Create
.envfile:
WEATHER_API_KEY=your_api_key_hereComing Tomorrow
Tomorrow we’ll analyze this collected data — create temperature trend charts, identify patterns, compare cities, visualize precipitation, and turn raw numbers into meaningful insights with matplotlib and pandas!
Skeleton and Solution
Below you will find both a downloadable skeleton.py file to help you code the project with comment guides and the downloadable solution.py file containing the correct solution.
Get the code skeleton here:
Get the code solution here: