

Build a Weather Data Analytics & Forecasting Tool: Day 3 - Advanced Analytics & Predictions
Level: Advanced

Projects in this week’s series:
This week, we progressively build a weather data analytics and forecasting tool with Python.
Day 1: Weather Data Collector
Day 2: Weather Data Analysis & Visualization
Day 3: Advanced Analytics & Predictions (Today)
Today’s Project
Welcome to the finale! We’ve collected weather data and created visualizations. Today we’re adding advanced analytics — moving averages, correlation analysis, trend detection, simple forecasting with linear regression, and comprehensive PDF reports with embedded charts!
We’re transforming your weather tool into a professional analytics platform that predicts future conditions and generates publication-ready reports!
Project Task
Create an advanced weather analytics system that:
Calculates moving averages for temperature smoothing
Performs correlation analysis (temp vs humidity, etc.)
Detects weather patterns and trends
Creates simple forecasts using linear regression
Generates heatmaps for multi-variable analysis
Identifies seasonal patterns
Creates comprehensive PDF reports with all charts
Exports analytics summary as formatted document
This project gives you hands-on practice with statistical analysis, machine learning basics, correlation studies, predictive modeling, report generation, and building production-ready analytics tools — essential skills for data science careers!
Expected Output
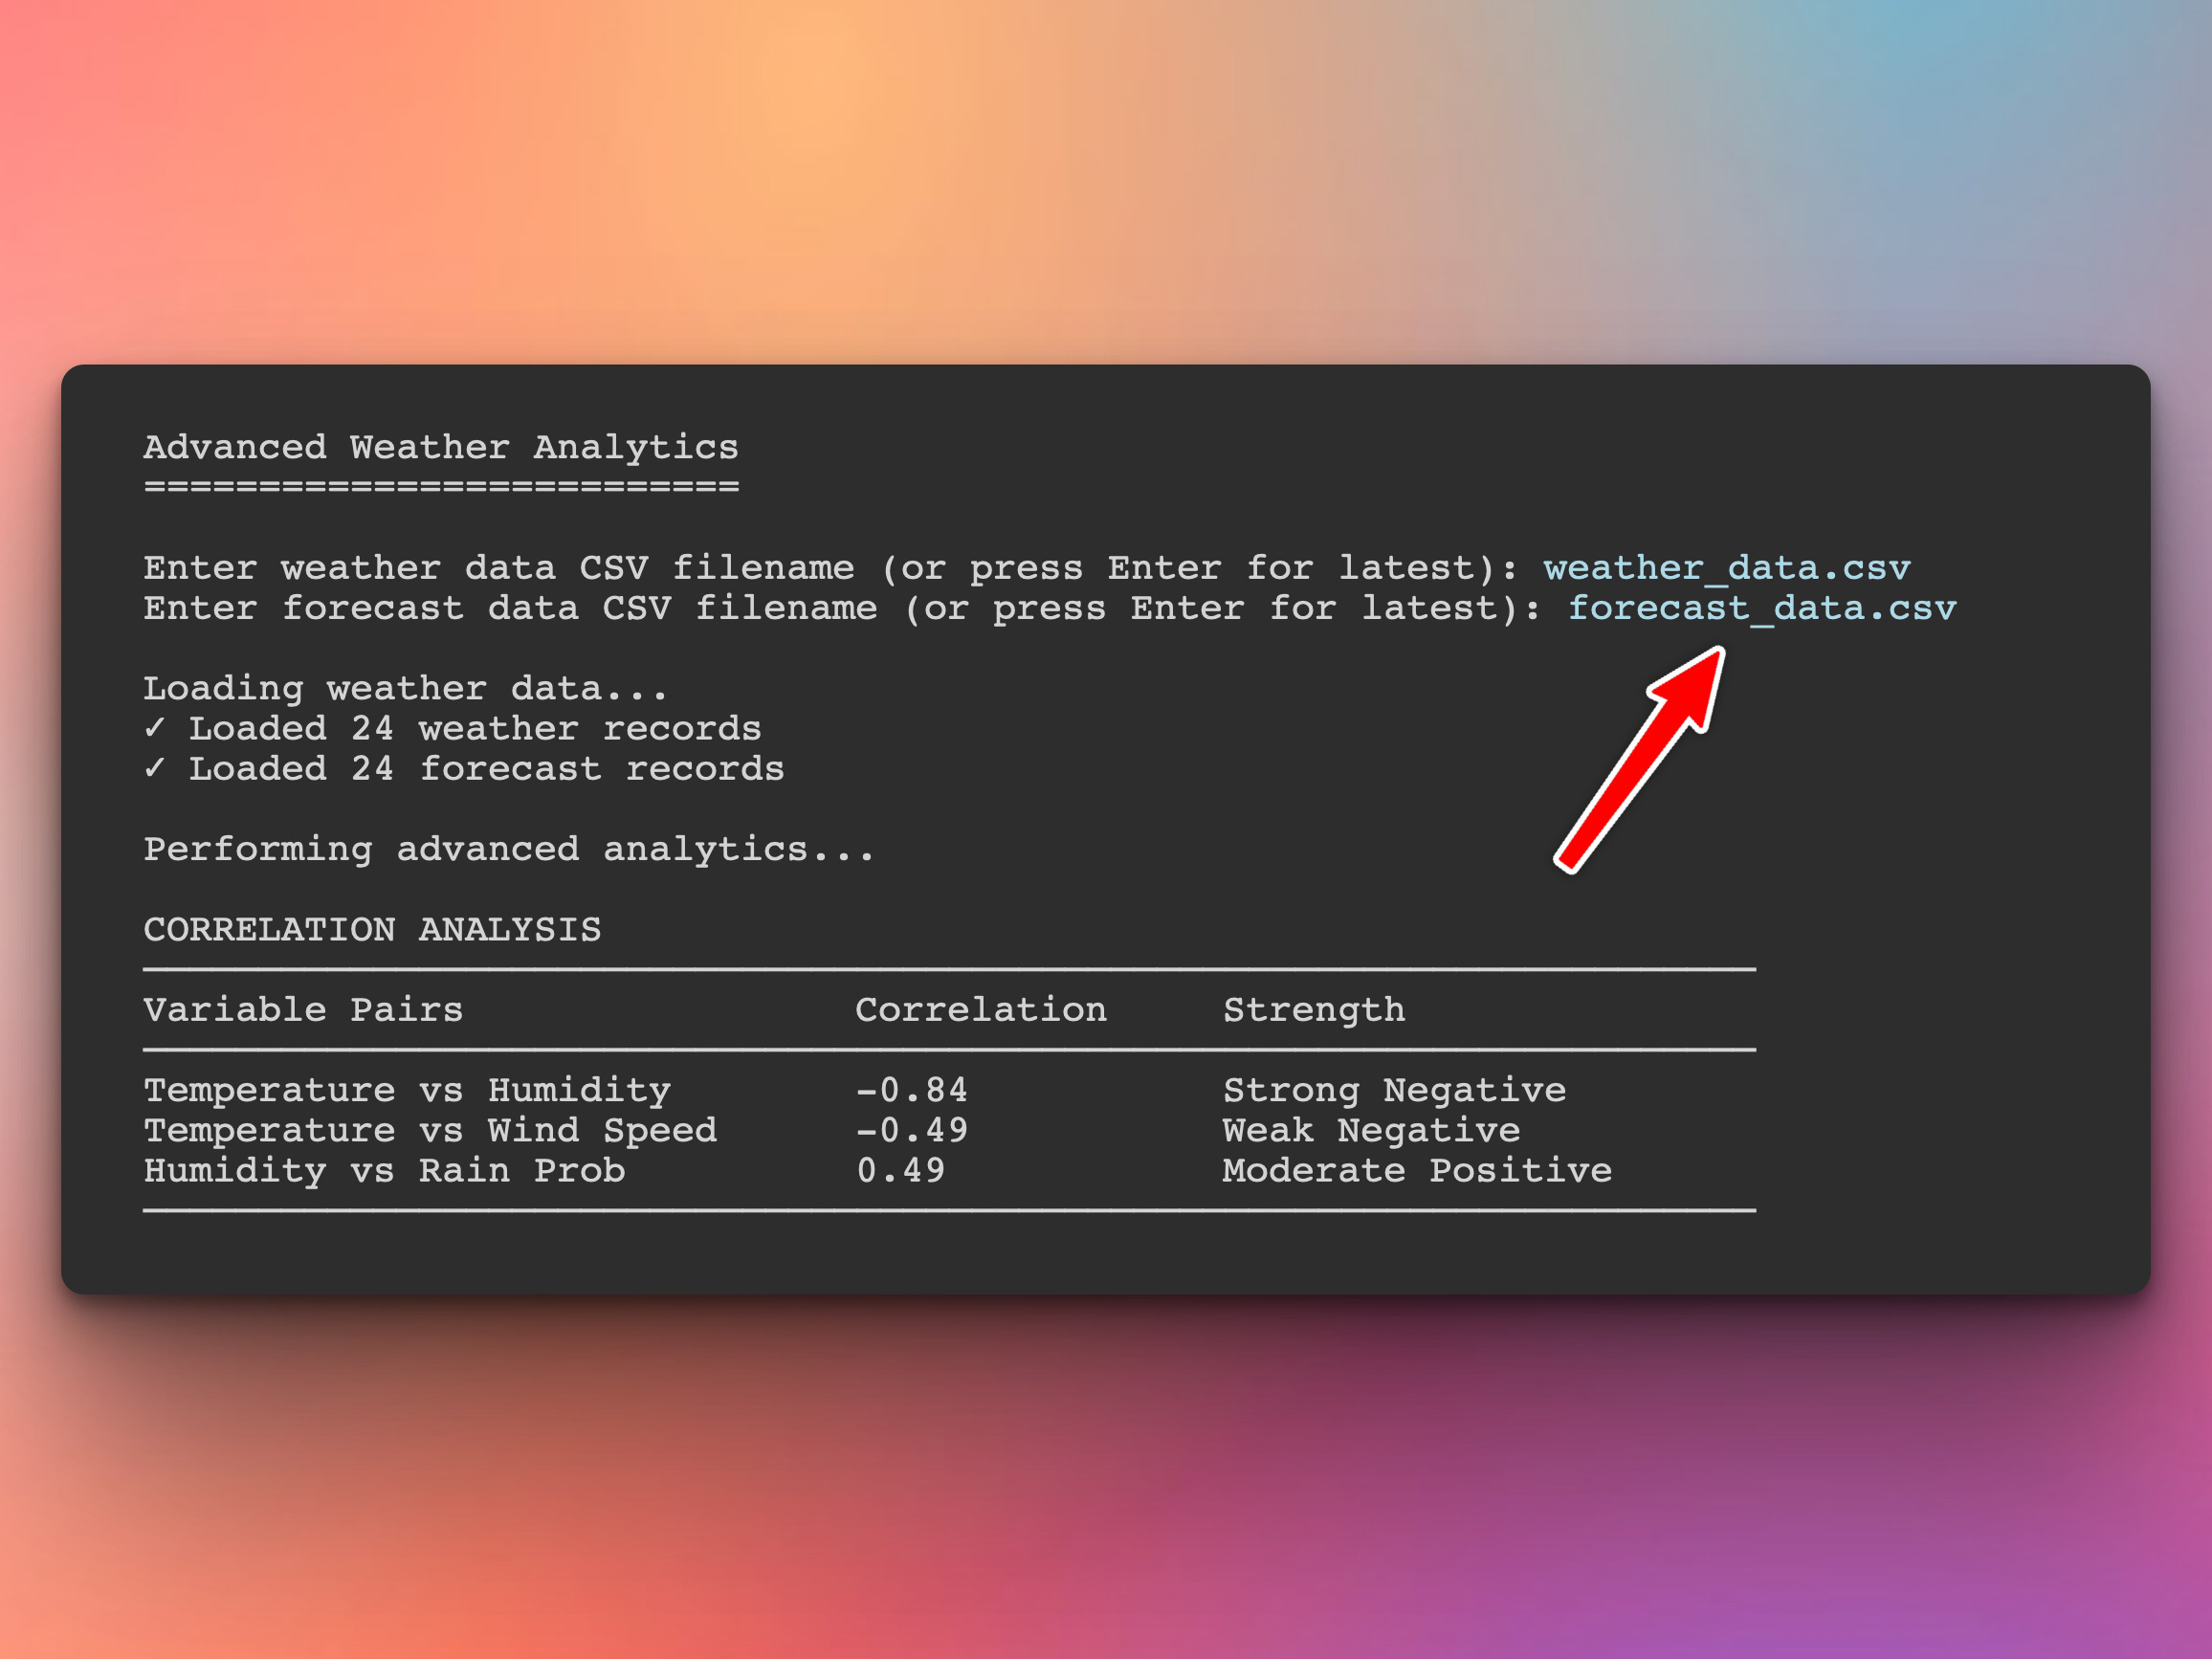
When you run the program, it will ask you to type in the name of the CSV files as below:
Download the sample CSV files here if you don’t have the data.
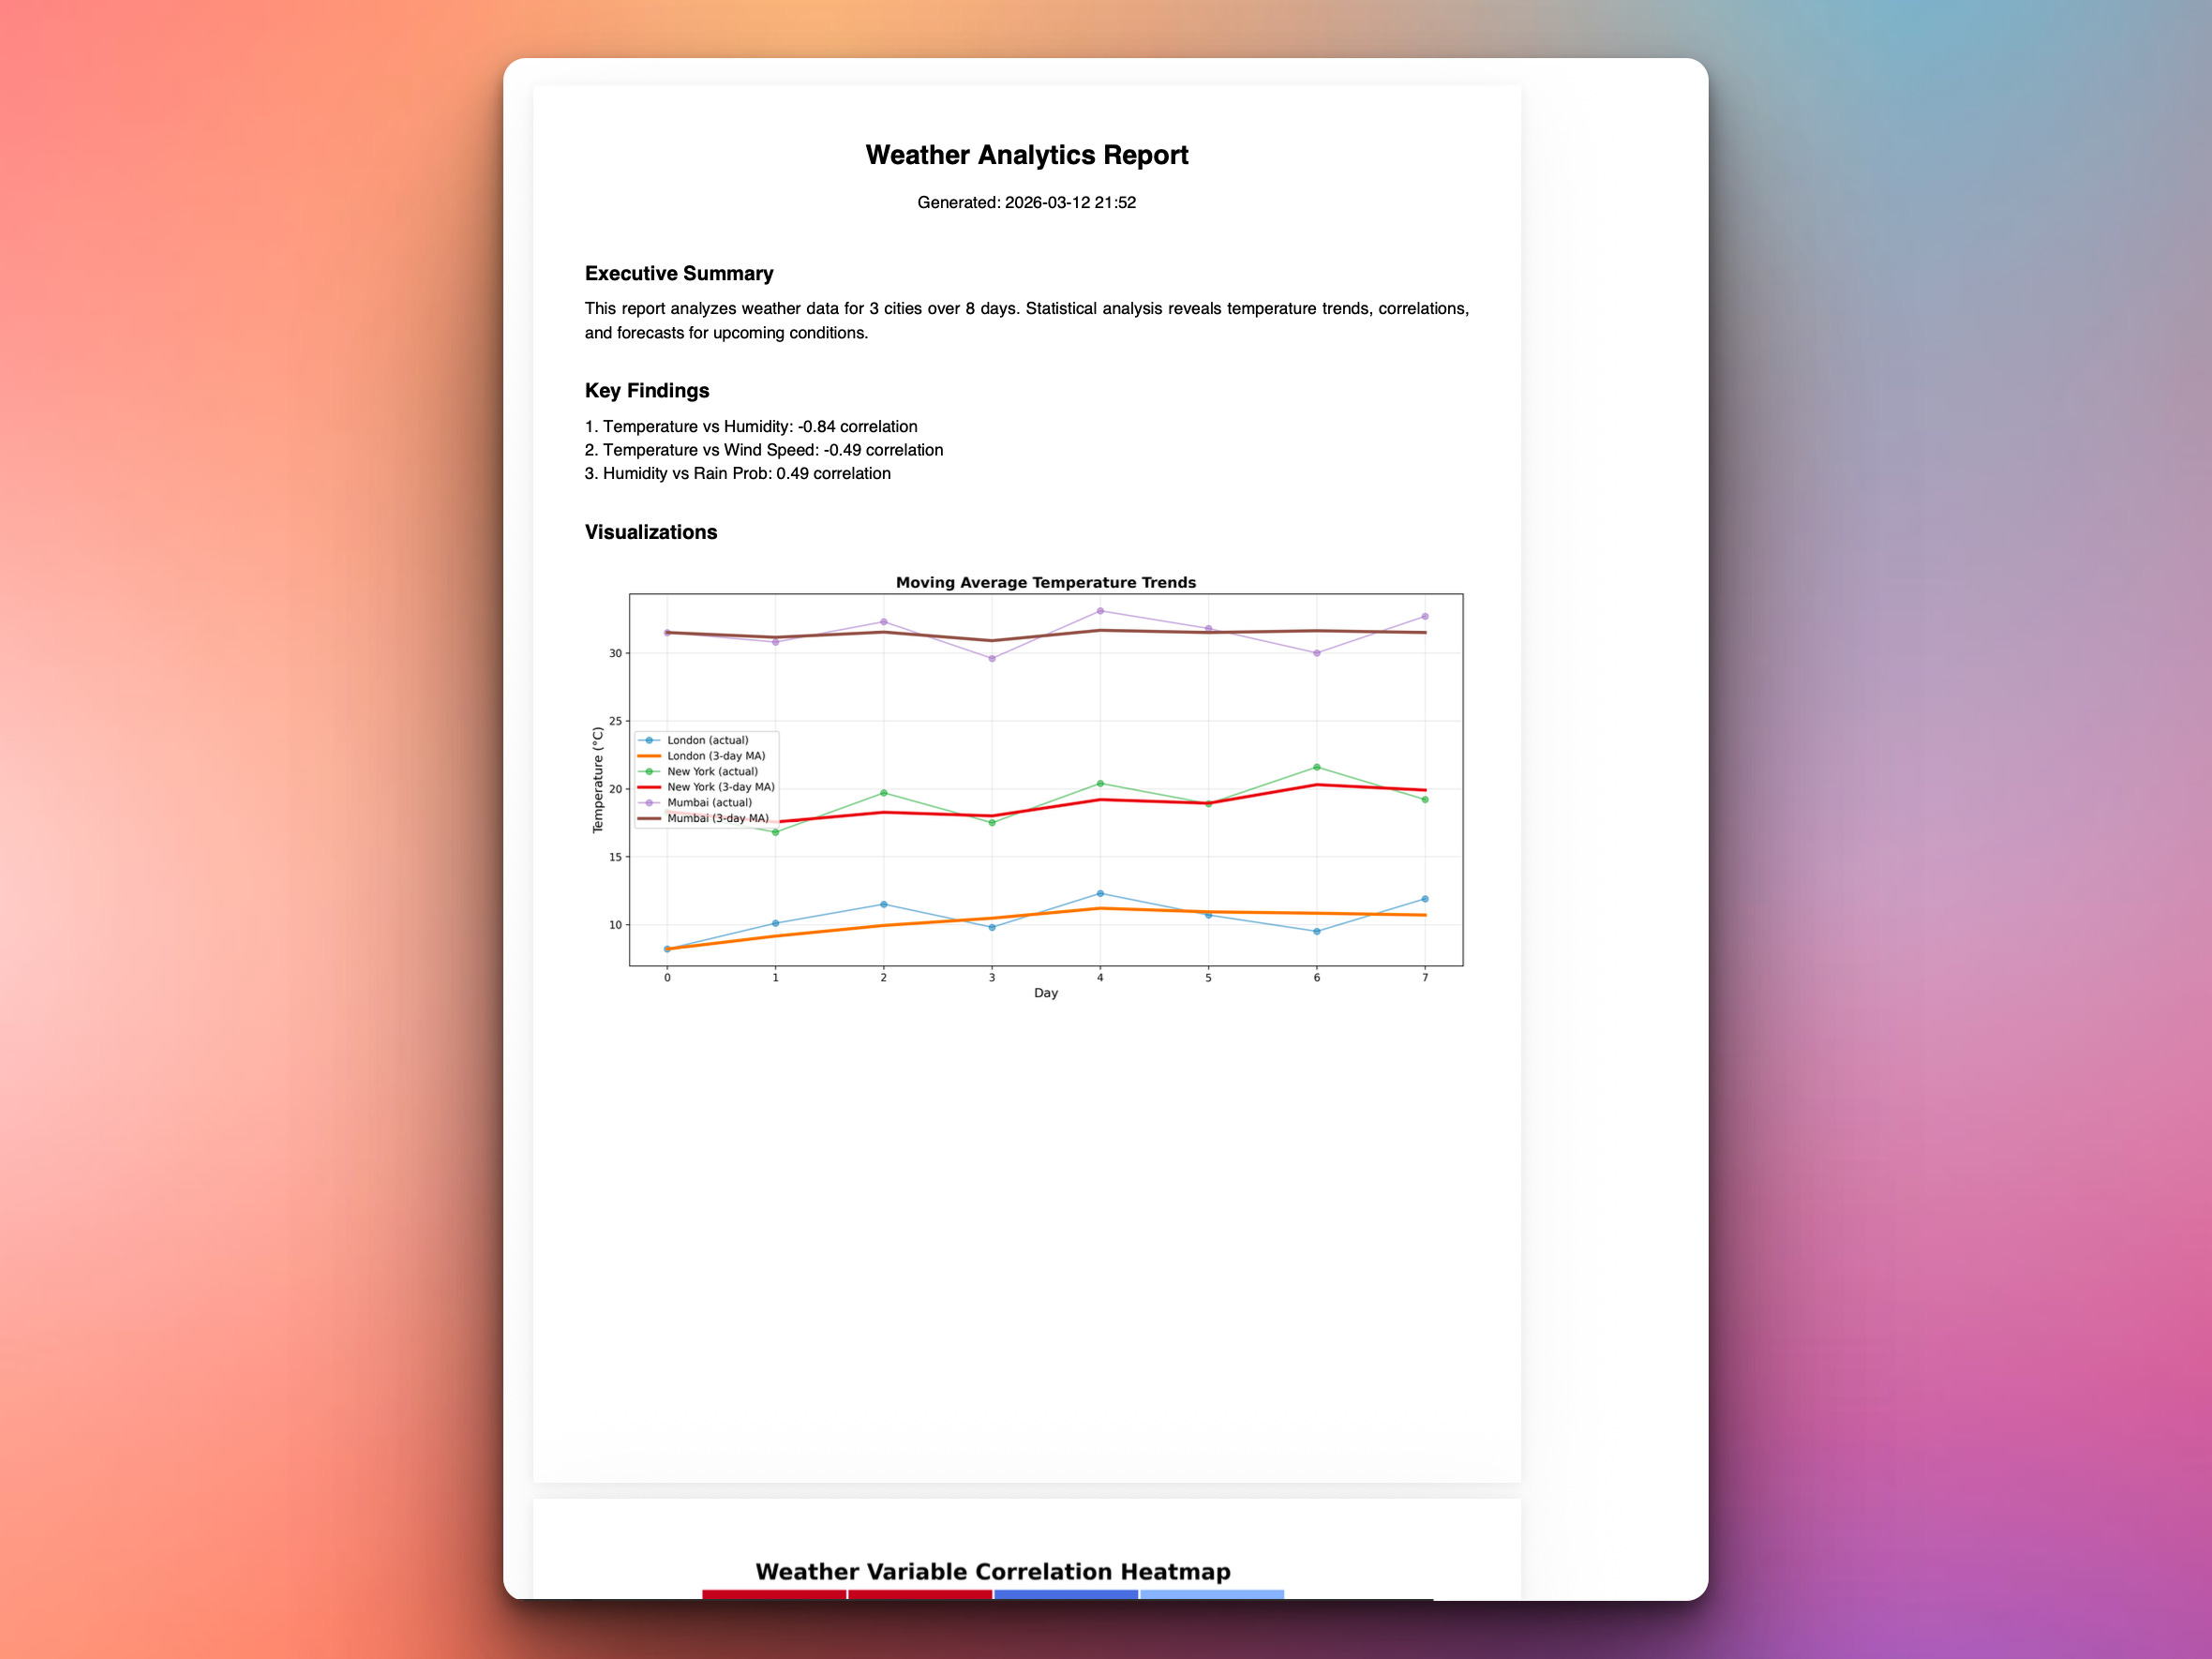
Then, a PDF report will be generated. Here is the PDF generated from the code I ran:
What You’ve Accomplished This Week
🎉 Congratulations! You’ve built a complete weather analytics platform and learned:
Day 1: API integration and data collection pipelines
Day 2: Data visualization and statistical summaries
Day 3: Advanced analytics, predictions, and professional reporting
You now have a production-ready weather analytics system that: ✅ Collects real-time weather data ✅ Analyzes patterns and trends ✅ Creates professional visualizations ✅ Performs correlation analysis ✅ Forecasts future conditions ✅ Generates PDF reports
This is a complete data science project from end to end — data collection, analysis, visualization, prediction, and reporting!
View Code Evolution
Compare today’s solution with earlier versions and see how we evolved from simple data collection to a complete analytics platform.
Keep reading with a 7-day free trial
Subscribe to Daily Python Projects to keep reading this post and get 7 days of free access to the full post archives.