

Build an AI Travel Itinerary Planner: Day 1 - Interactive Trip Map with Folium
Build an interactive HTML map with color-coded day markers, drawn routes, detailed popups, and professional touches like a minimap and fullscreen.

Projects in this week’s series:
This week, we build an AI Travel Itinerary Planner that turns a destination into a beautiful, interactive map you can explore and share — perfect for trip planning!
Why build this? Because planning a trip means juggling places, routes, and notes across a dozen browser tabs. You’ll build a tool that puts everything on one interactive map — and by Day 3, an AI generates the whole itinerary for you.
What you’ll learn: Interactive map creation, geographic data visualization, AI-powered content generation, and building shareable web apps — essential skills for location-based applications.
Why users love this: Type a city, get a gorgeous map with every stop pinned, routes drawn, and tips in every popup. It feels like a real travel product.
Day 1: Interactive Trip Map with Folium (Today)
Day 2: AI Itinerary Generator with Gemini
Day 3: Travel Planner Web App
Today’s Project
We’re starting with the map engine — the visual heart of the whole project. No AI yet. Today you master Folium: take a structured trip itinerary and turn it into a rich, interactive HTML map with color-coded day markers, drawn routes, detailed popups, and professional touches like a minimap and fullscreen mode.
By the end, you’ll have a real interactive map you can open in any browser and share. On Day 2, the AI will generate the data you’re hand-feeding it today.
Project Task
Build an interactive trip map generator that:
Takes a structured multi-day itinerary (list of stops with name, day, coordinates, description, category)
Plots every stop as a marker on a Folium map
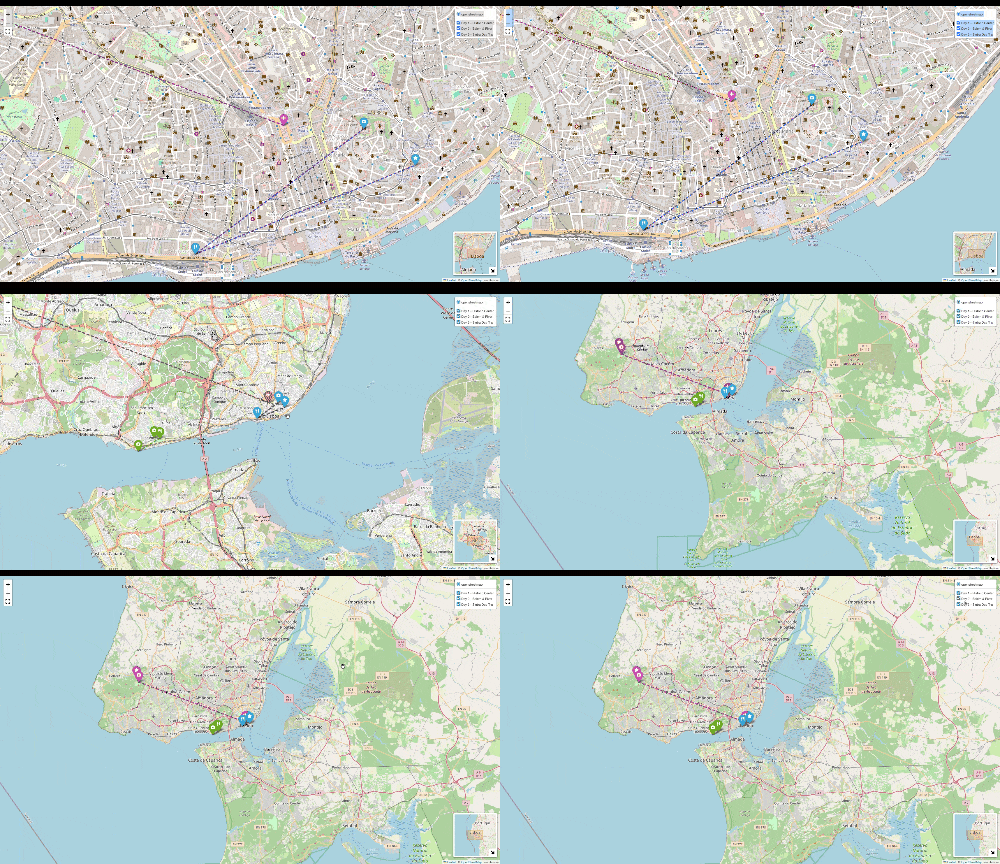
Color-codes markers by day (Day 1 = blue, Day 2 = green, etc.)
Uses category-based icons (food, sightseeing, hotel, activity)
Draws a route line connecting stops in order, per day
Rich HTML popups with stop name, description, and category
Auto-centers and auto-zooms to fit all stops
Adds a minimap, fullscreen button, and layer control
Saves the result as a standalone, shareable HTML file
This project gives you hands-on practice with Folium, interactive maps, geographic visualization, HTML generation, and structured data handling — essential skills for location-based applications.
Expected Output
Running the map generator:
python trip_map.py
Running the script will generate an HTML file which can be opened in the browser:
Setup Instructions
Install Required Package:
pip install foliumThat’s it — one dependency. Folium generates the map as HTML; no server needed.
Run it:
python trip_map.py
Then open trip_map.html in any browser.
Understanding the Itinerary Data Structure
Before drawing anything, we need a clean data structure. Each stop is a dictionary, and the trip is a list of them:
itinerary = [
    {
        "name": "Time Out Market",
        "day": 1,
        "lat": 38.7067,
        "lon": -9.1459,
        "category": "food",
        "description": "Historic food hall with dozens of local vendors."
    },
    {
        "name": "São Jorge Castle",
        "day": 1,
        "lat": 38.7139,
        "lon": -9.1335,
        "category": "sightseeing",
        "description": "Moorish castle with panoramic views over the city."
    },
    # ... more stops
]
Why this structure?
It is flat, predictable, and easy to generate. On Day 2, Gemini will return exactly this shape as JSON — so the map code you write today works unchanged when the AI takes over. That is the whole point of starting with the map: you build a stable target, then plug the AI into it.
Understanding Folium Basics
Folium is a Python wrapper around Leaflet.js. You build a map in Python, and it writes the HTML/JavaScript for you.
import folium

# Create a map centered on a location
m = folium.Map(location=[38.7223, -9.1393], zoom_start=13)

# Add a marker
folium.Marker(
    location=[38.7067, -9.1459],
    popup="Time Out Market",
    tooltip="Click for details"
).add_to(m)

# Save to HTML
m.save("map.html")
Three core ideas:
The map object (
folium.Map) is the canvas — everything gets added to it.Elements (markers, lines, layers) are created, then attached with
.add_to(m)..save()writes a complete, standalone HTML file — no server, no dependencies for the viewer.
Understanding Color-Coded Day Markers
To make a multi-day trip readable, each day gets its own color. Folium markers accept an Icon with a color and an icon glyph:
DAY_COLORS = ["blue", "green", "purple", "orange", "red", "darkblue"]

def get_day_color(day_number):
    # Day 1 -> index 0, wraps around for long trips
    return DAY_COLORS[(day_number - 1) % len(DAY_COLORS)]

folium.Marker(
    location=[stop["lat"], stop["lon"]],
    icon=folium.Icon(color=get_day_color(stop["day"]), icon="cutlery", prefix="fa")
).add_to(m)
Why prefix="fa"? It tells Folium to use Font Awesome icons, which gives you a much larger glyph library (cutlery, camera, bed, etc.) than the default set.
Understanding Category Icons
Color tells you which day. The icon glyph tells you what kind of stop it is. A simple dictionary maps categories to Font Awesome icons:
CATEGORY_ICONS = {
    "food": "cutlery",
    "sightseeing": "camera",
    "hotel": "bed",
    "activity": "star",
    "transport": "plane",
}

def get_category_icon(category):
    # Fallback to a generic marker if the category is unknown
    return CATEGORY_ICONS.get(category, "info-sign")
Now a blue cutlery marker reads instantly as “Day 1 food stop.” This visual encoding is what separates a real map from a pile of identical pins.
Understanding Rich HTML Popups
A popup can be plain text — or it can be styled HTML. Folium accepts an HTML string, so you can build a proper info card:
def build_popup_html(stop):
    return f"""
    <div style="width: 220px; font-family: sans-serif;">
        <h4 style="margin: 0 0 6px 0;">{stop['name']}</h4>
        <hr style="margin: 4px 0;">
        <p style="margin: 4px 0;"><b>{stop['category'].title()}</b> · Day {stop['day']}</p>
        <p style="margin: 4px 0; color: #444;">{stop['description']}</p>
    </div>
    """

popup = folium.Popup(build_popup_html(stop), max_width=250)
folium.Marker(location=[stop["lat"], stop["lon"]], popup=popup).add_to(m)
Key detail: wrap the HTML in folium.Popup(..., max_width=250). Without max_width, long descriptions render as one ugly unwrapped line. The <div> with a fixed width keeps every popup tidy.
Understanding Route Lines with PolyLine
To connect the stops of a day in order, use folium.PolyLine — it draws a line through a list of coordinates:
def draw_day_route(day_stops, color, map_obj):
    # day_stops must already be in visiting order
    coordinates = [[stop["lat"], stop["lon"]] for stop in day_stops]

    folium.PolyLine(
        locations=coordinates,
        color=color,
        weight=4,
        opacity=0.7,
        dash_array="8"  # dashed line looks like a travel route
    ).add_to(map_obj)
We draw one PolyLine per day, using that day’s color. The result: three colored, dashed routes that show the flow of each day, not one tangled line across the whole trip.
Understanding Auto-Centering and Auto-Zoom
Hardcoding location and zoom_start breaks the moment the trip changes. Instead, let the data decide the view with fit_bounds:
def fit_map_to_stops(map_obj, itinerary):
    lats = [stop["lat"] for stop in itinerary]
    lons = [stop["lon"] for stop in itinerary]

    # Bounding box: [[south, west], [north, east]]
    south_west = [min(lats), min(lons)]
    north_east = [max(lats), max(lons)]

    map_obj.fit_bounds([south_west, north_east])
fit_bounds computes the zoom and center so every stop is visible with a little padding. Now the map works for a walkable city or a sprawling road trip without any manual tuning — which matters on Day 2, when the AI generates unpredictable destinations.
Understanding LayerControl and FeatureGroups
To toggle days on and off, each day goes into its own FeatureGroup. A LayerControl then renders the checkboxes:
day_group = folium.FeatureGroup(name="Day 1 — Historic Center")

# add that day's markers and route to the group instead of the map
marker.add_to(day_group)

day_group.add_to(map_obj)

# add this LAST, after all groups exist
folium.LayerControl(collapsed=False).add_to(map_obj)
Order matters: add LayerControl after every FeatureGroup, or some layers won’t appear in the control.
Understanding Map Plugins
Folium ships plugins that add real polish in one line each:
from folium.plugins import MiniMap, Fullscreen

# Small overview map in the corner
MiniMap(toggle_display=True).add_to(m)

# Fullscreen button
Fullscreen().add_to(m)
The MiniMap helps users keep their bearings when zoomed in; Fullscreen makes the shared HTML feel like a proper app. Small additions, big difference in perceived quality.
Practical Use Cases
1. Personal trip planning:
Hand-build your itinerary, get one map with every stop, route, and note.
2. Sharing plans with travel companions:
Send the HTML file — they open it, no install, fully interactive.
3. Travel blogs and guides:
Embed the map in a post so readers can explore the route themselves.
4. Tour and event planning:
Color-code by day or group, drop notes in popups, share one link.
5. Foundation for Day 2:
The exact data shape Gemini will return — the map is ready before the AI exists.
Coming Tomorrow
Tomorrow we add the AI. Instead of hand-writing the itinerary, you’ll describe a trip in plain English (”3 days in Lisbon, I love food and history”) and Gemini — via LangChain v1 — generates the full structured itinerary, coordinates included, ready to drop straight into today’s map engine.
Skeleton and Solution
Below you will find both a downloadable skeleton.py file to help you code the project with comment guides and the downloadable solution.py file containing the correct solution.
Get the code skeleton here:
Get the code solution here:
This one seems very useful....
I used to do this by hand with Google's My Maps site, I thought it was a great day when I could just upload a CSV with locations, lol.