

Plot employee salaries by the department with Python and Plotly
Level: Real-World

Project Brief
Your task for this project is to plot some employee data using Python and the plotly library.
Step-by-Step Instructions
Download this employee data. Here is an excerpt of the data:

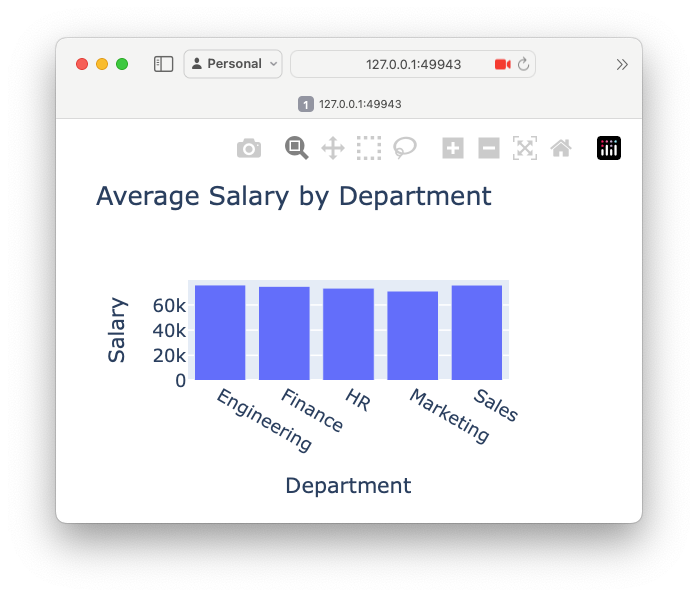
Create a plot that shows the average salary by department. The graph should look similar to the following.

Environment Setup Instructions
Keep reading with a 7-day free trial
Subscribe to Daily Python Projects to keep reading this post and get 7 days of free access to the full post archives.