

Data Dashboard Bar Graph with Slider Using Streamlit
Level: Real-World

Project Brief
Your task for this project is to produce the following graph using Python and the Streamlit library.
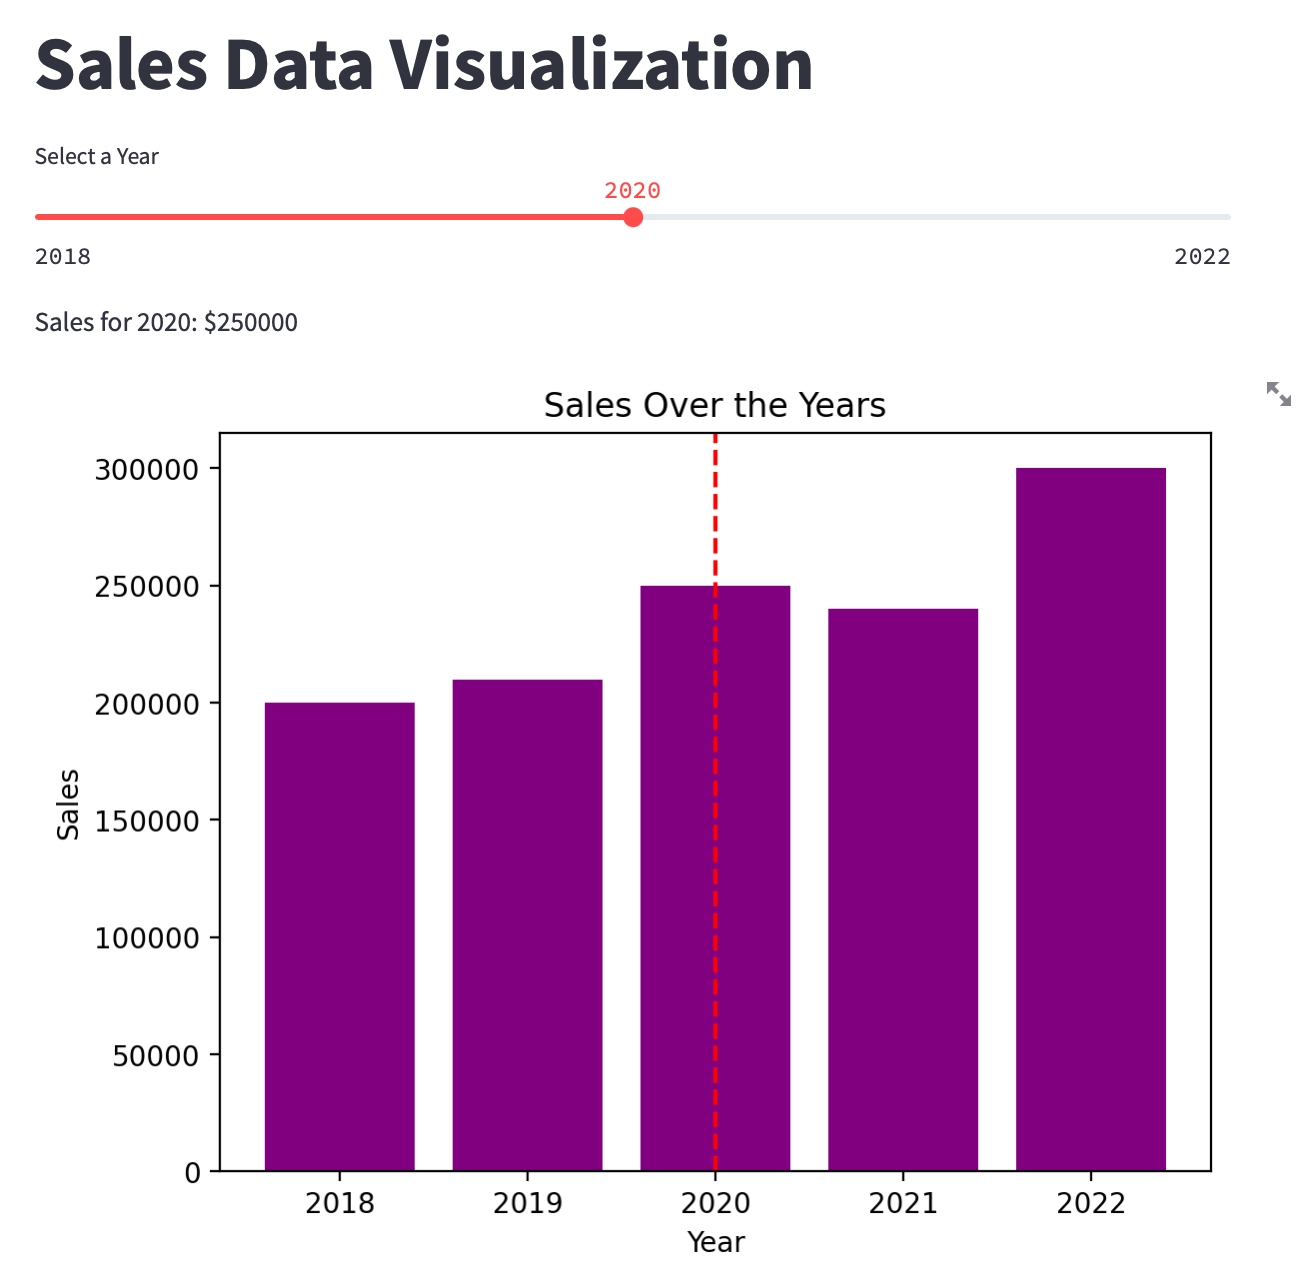
The slider controls the dashed red line position.
Step-by-Step Instructions
Keep reading with a 7-day free trial
Subscribe to Daily Python Projects to keep reading this post and get 7 days of free access to the full post archives.