

Python GUI App to Generate a Histogram
Level: Real-World

Project Description
Your task for today is to build a real-world Histogram of Ages app using Python. The program should:
Let users input a list of ages (either manually or from a file)
Display a histogram that shows the distribution of ages across defined age groups (e.g., 0–9, 10–19, 20–29, etc.)
Include a GUI where users can either paste age data or load it from a CSV/text file
Display the histogram using a visual chart library like matplotlib
This project will help you practice GUI building, data processing, and data visualization.
Expected Output
The app window should include:
A text box to paste a comma-separated list of ages (e.g.,
25,34,45,18,22,9)A button to load ages from a file (CSV or TXT)
A button to generate the histogram
A matplotlib-based bar chart embedded in the GUI, showing how many people fall into each age range
Here is what the app should look like and behave. The user may input a list of comma separated ages, or load a file with ages inside, and then the program will generate and show the histogram of the data.
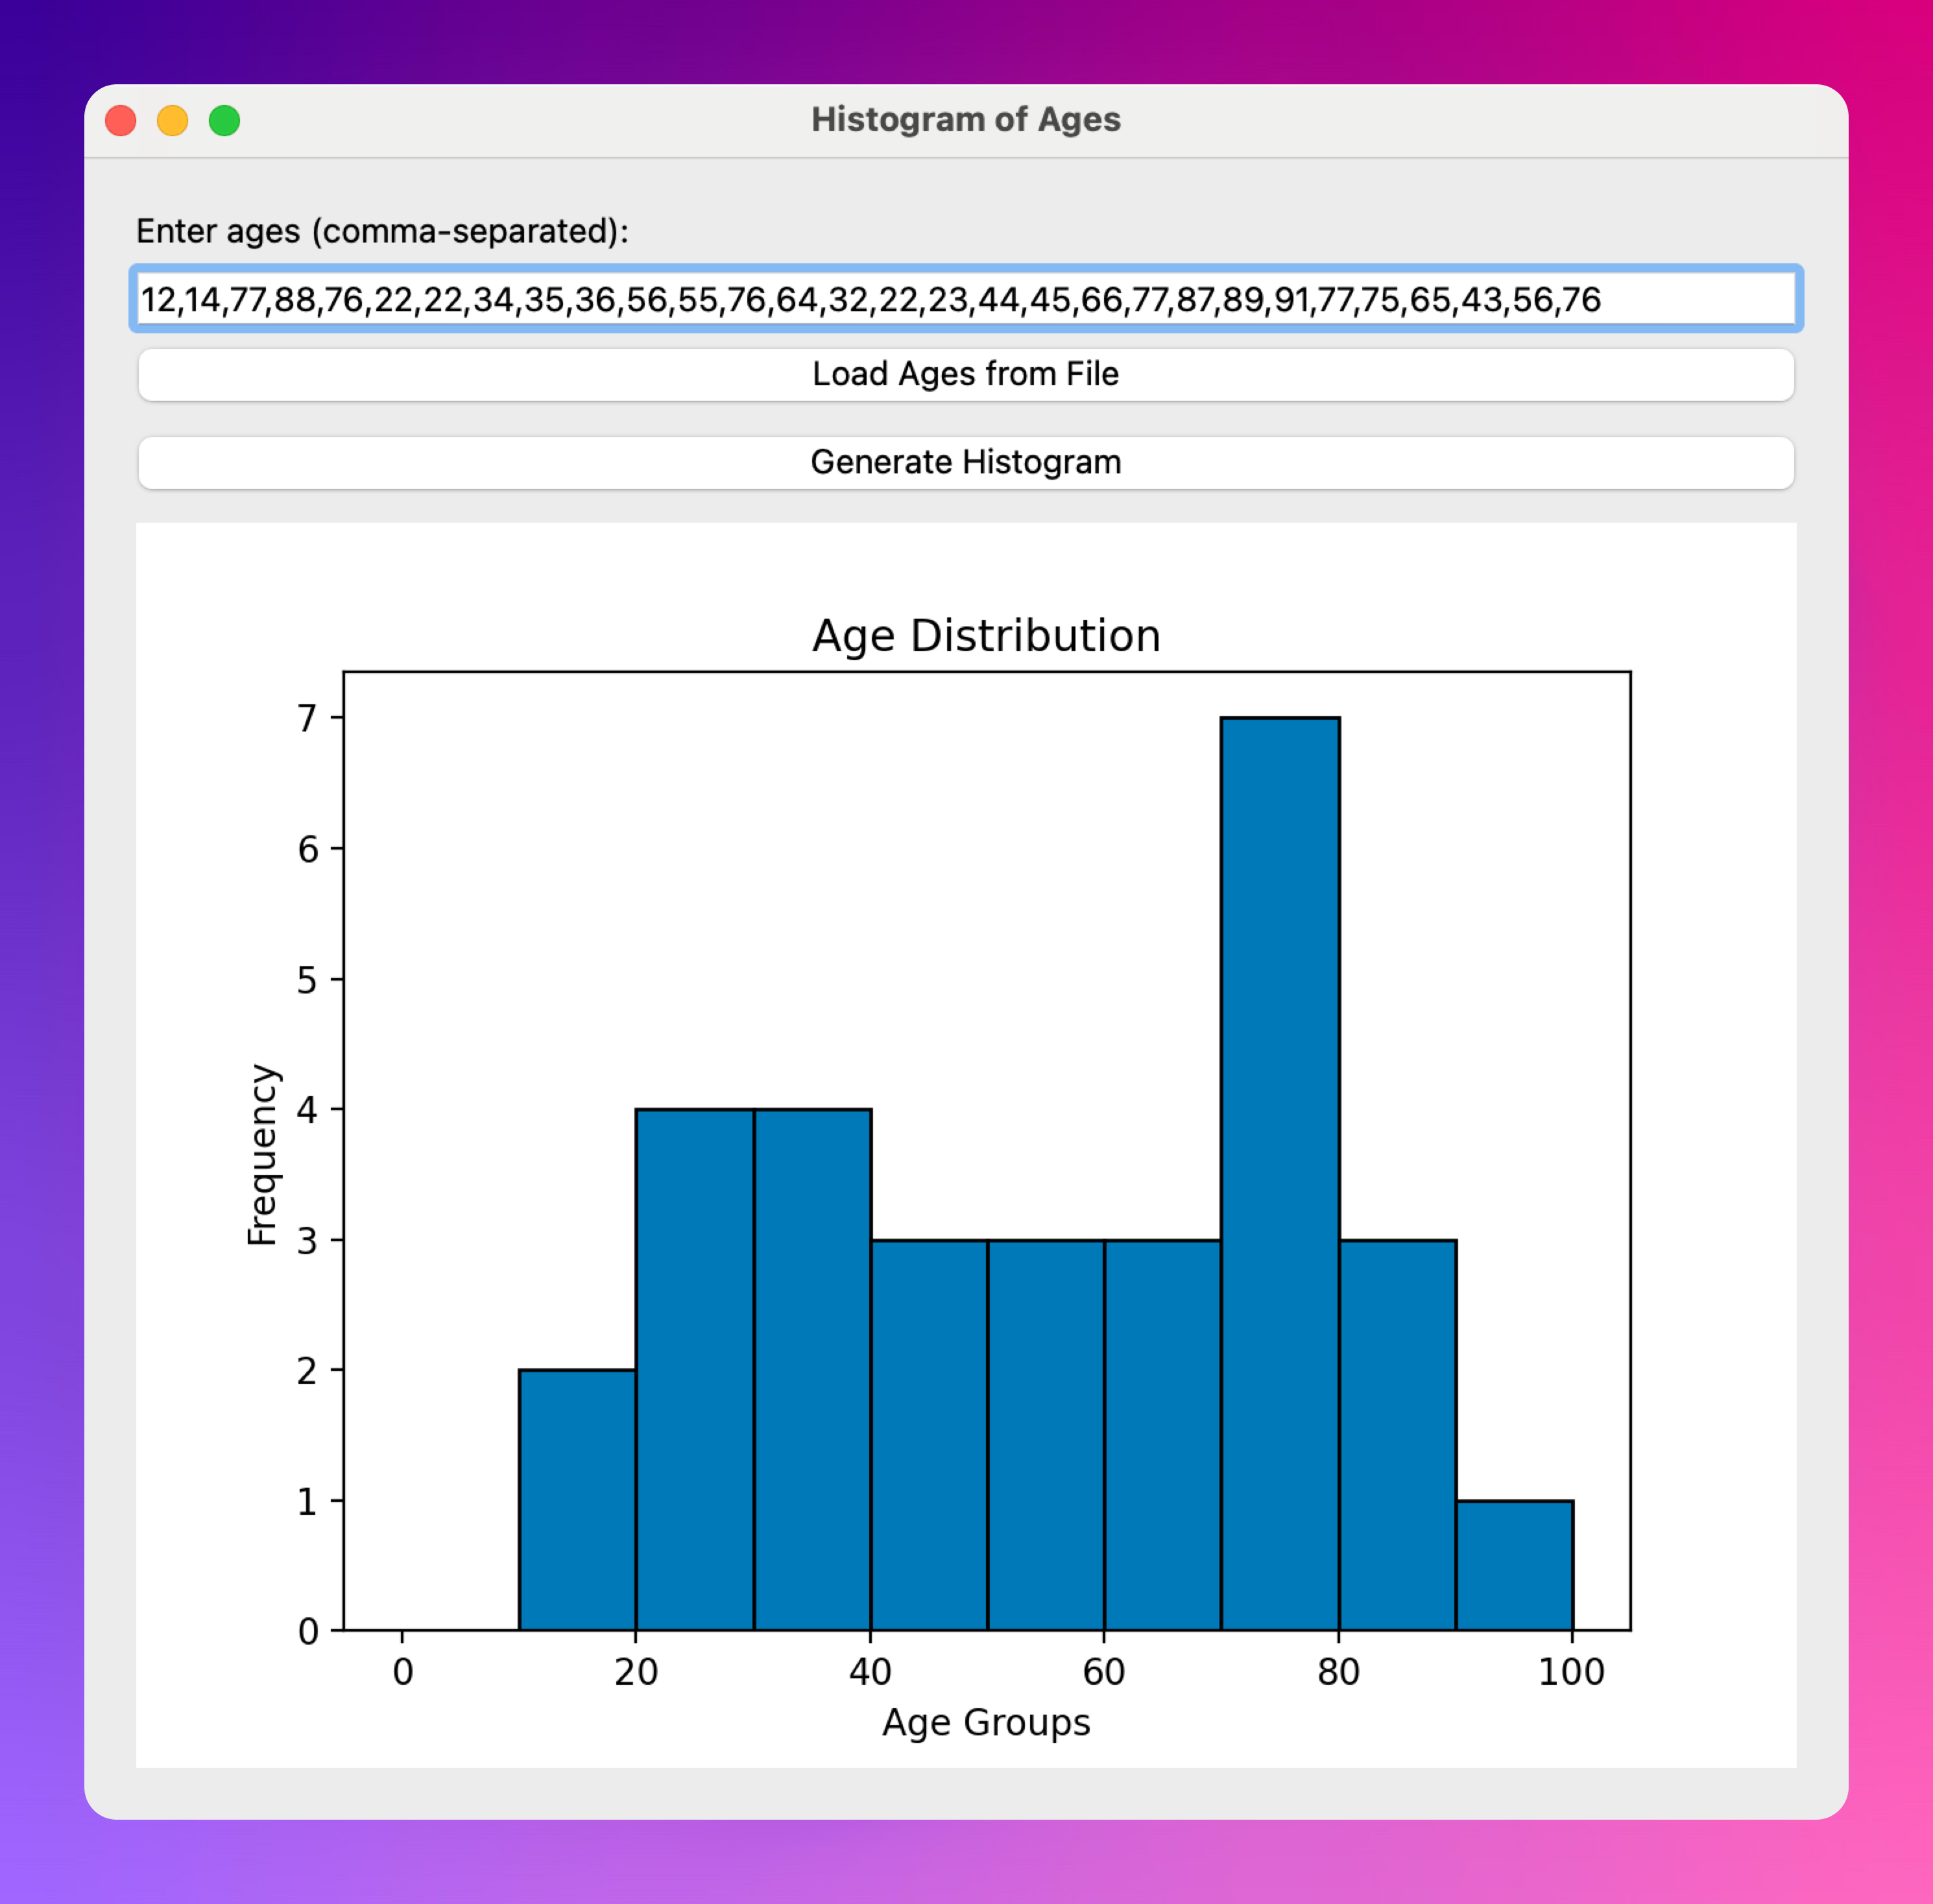
For example, above we can see that the most common age in the data is between 70 and 80 years old.
💡 Hint
Don’t know where to start? This hint will show you how to begin.
𝌣 Solution
🔒 This solution is available to paid subscribers only.