

Python Project: Plot Numbers from Text Files Using Streamlit
Level: Real-World Project

Project Overview 💡
In this project, you'll create a Streamlit app that reads numerical data from text files in a folder and visualizes it using a line chart. This combines file handling, data processing with pandas, and interactive plotting with Streamlit.
Challenge Yourself! 🚀
Before checking the solution, try building a Streamlit app that visualizes numbers stored in .txt files inside a folder.
Task:
Write a Streamlit app that:
Reads numbers from all
.txtfiles in a folder
Please download and use the text files in the link below:Extracts the filename (without extension) and number from each file
Plots the numbers using Streamlit's line chart
Displays the file name and number as a reference list
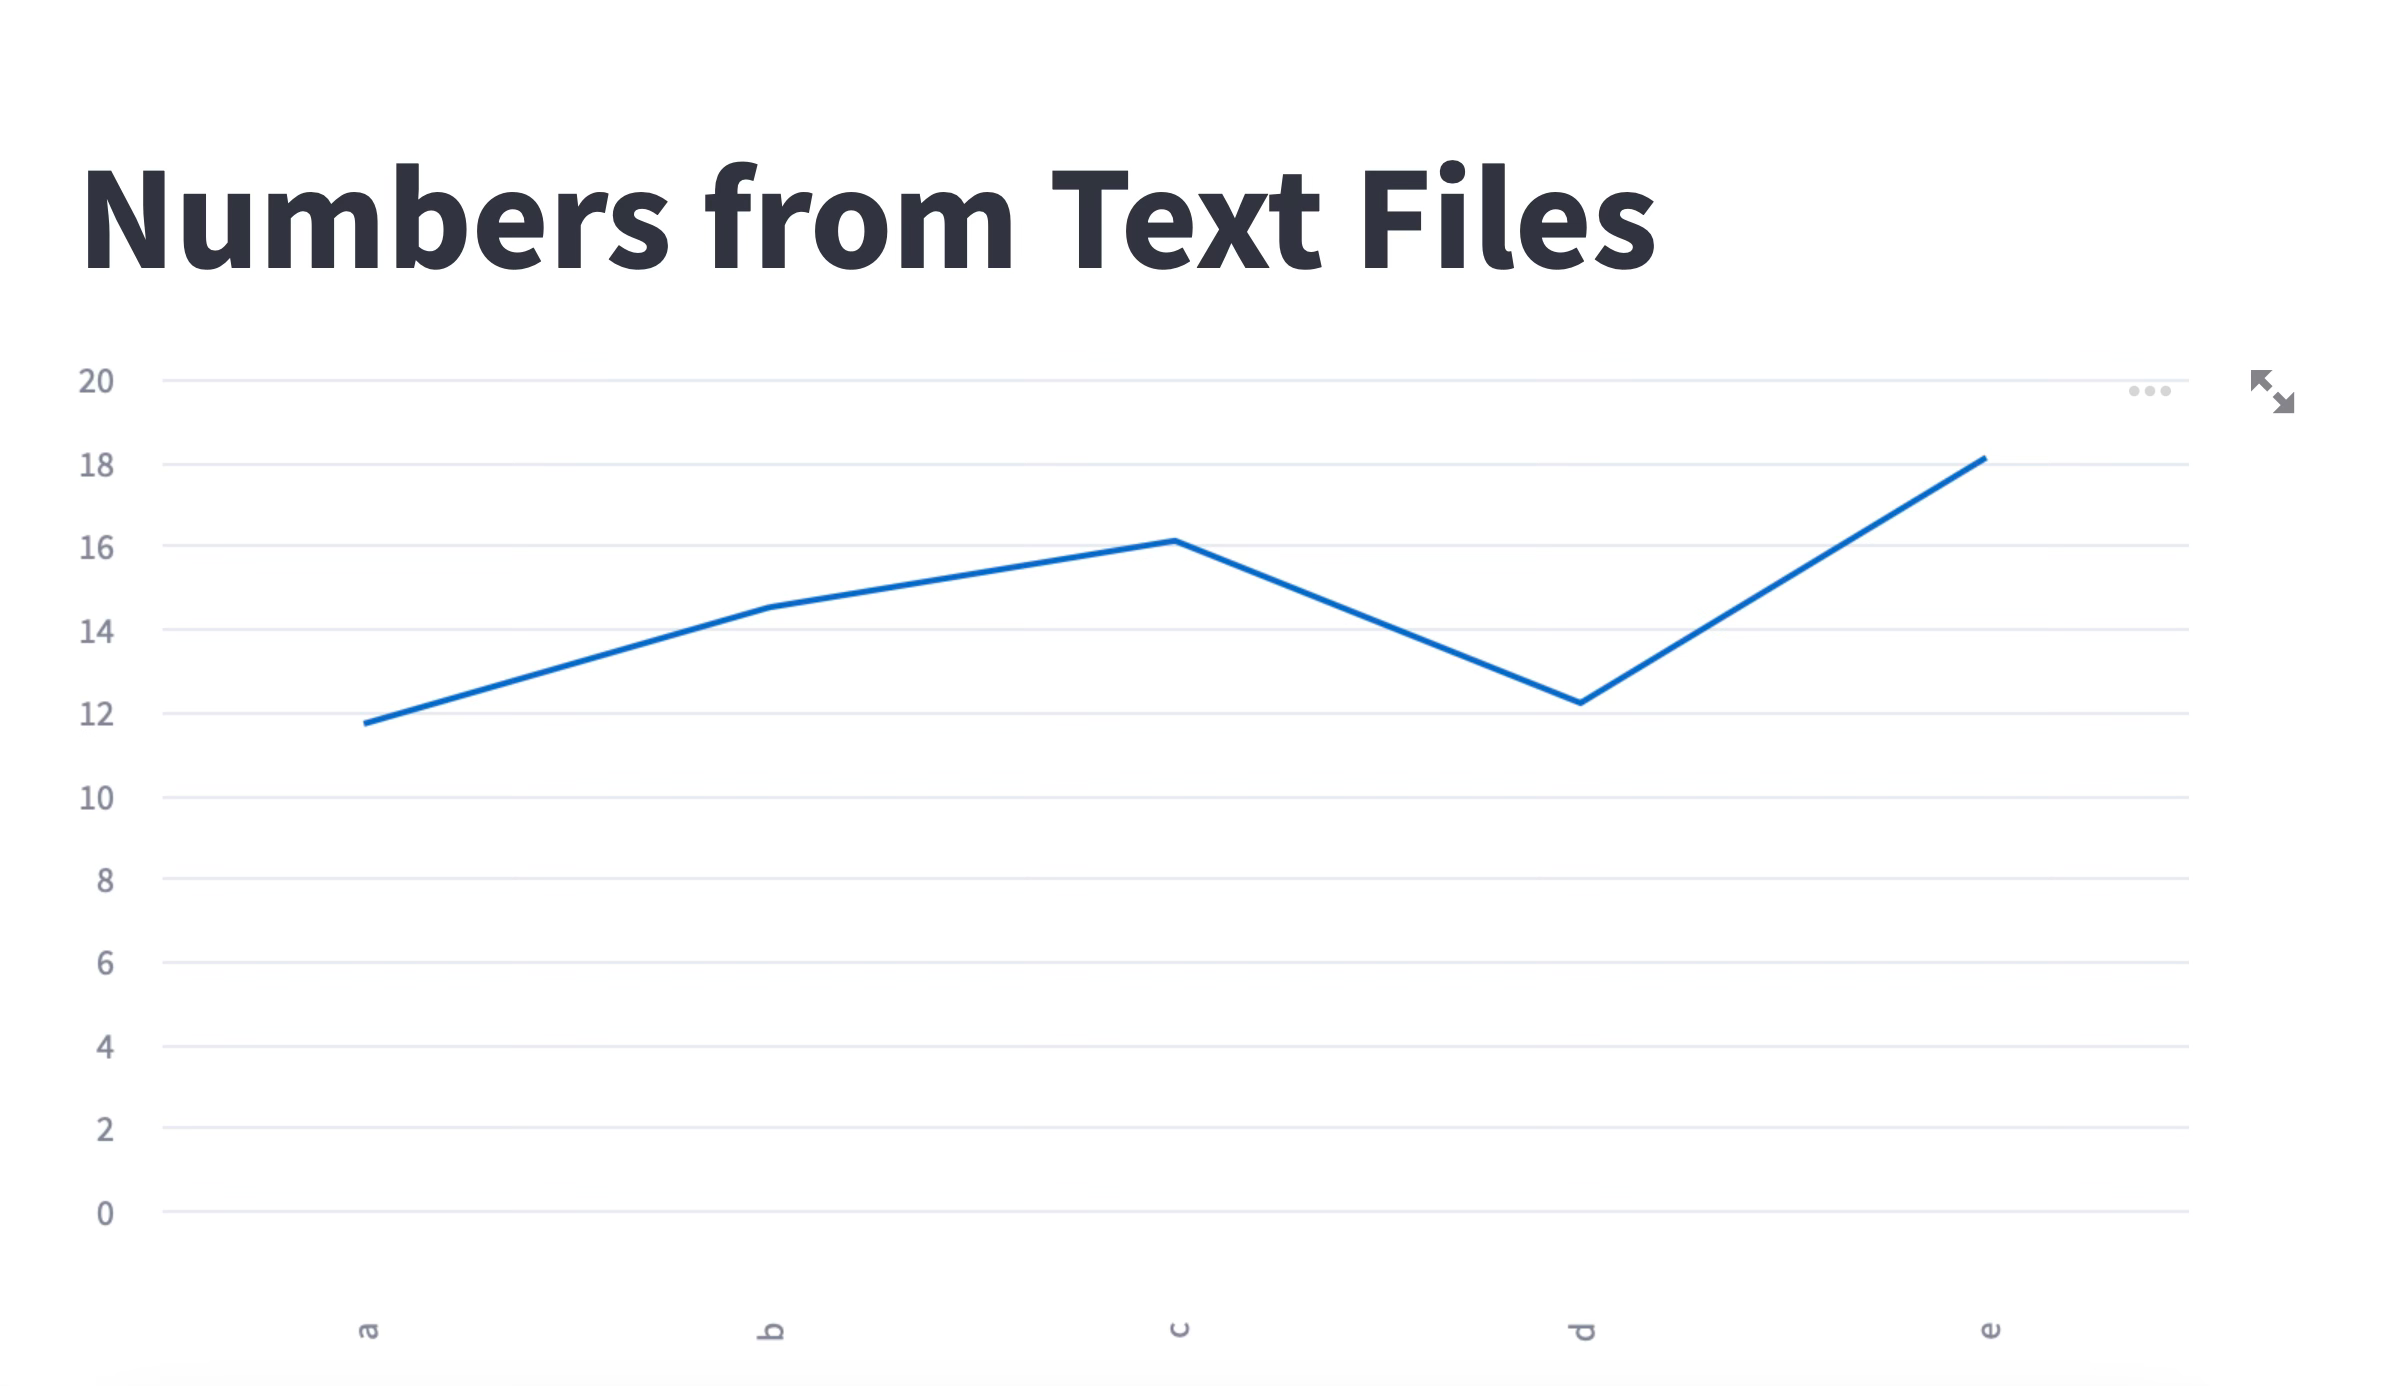
Expected Output: An interactive line chart showing values from the text files and a list of corresponding filenames with their values.
Give it a shot! Scroll down when you're ready for the step-by-step guide.
Spoiler Alert!
Step-by-Step Guide
Step 1️⃣: Import Required Libraries
We’ll use os for file operations, pandas for data handling, and streamlit for the app interface.
Keep reading with a 7-day free trial
Subscribe to Daily Python Projects to keep reading this post and get 7 days of free access to the full post archives.