

Visualizing the 2026 Eclipse with Python: Day 2 - Interactive Streamlit web map
Yesterday you built the astronomy engine. Today you wrap it in a world map that anyone can click.

Yesterday you built the astronomy engine — a Python script that takes a location and returns the precise eclipse timing for that spot, computed from the same JPL ephemerides NASA uses. Impressive as a CLI, but a terminal report isn’t something you share with friends, students, or your family WhatsApp group.
Today we take the same engine and wrap it in a live, interactive world map. Full eclipse path drawn as a bold red line across the North Atlantic. Cities in the path pre-marked as green dots, cities near it as orange or blue depending on coverage. Click anywhere on Earth and the sidebar populates with what you’ll see from that exact point — start time, maximum, end time in local timezone, coverage percentage, whether you’re in the path of totality. Search box for city lookup, live countdown to the moment of greatest eclipse. All in one Python file, wrapping yesterday’s script.
The lesson underneath: your astronomy engine should be reusable. Written well, compute_eclipse(lat, lon) is a pure function that doesn’t care whether it’s being called from a terminal script or a web app. Day 1’s file becomes an importable module for Day 2, and Day 2 is short because the hard work is already done. That separation between engine and interface is one of the most important design habits a working Python developer can build.
Projects in this week’s series:
Day 1: Command-line eclipse info tool (Yesterday)
Yesterday, we built a Python CLI script that computes precise eclipse timing for any location on Earth — start, maximum, and end times in local timezone, coverage percentage, whether you're inside the path of totality, and if so how long totality lasts. The astronomy runs off Skyfield with JPL DE421 ephemerides, accurate to within seconds of NASA's published numbers.
👉 Day 2: Interactive Streamlit web map (Today)
The same astronomy engine, wrapped in Streamlit + Folium. The full eclipse path is drawn as a bold red line arcing from Siberia across the North Pole, down through Iceland, across the Atlantic, into northern Spain, exiting over the Balearic Sea. Featured cities appear as colored dots: green for cities inside the path of totality, orange for cities with over 90% coverage, blue for moderate partials:
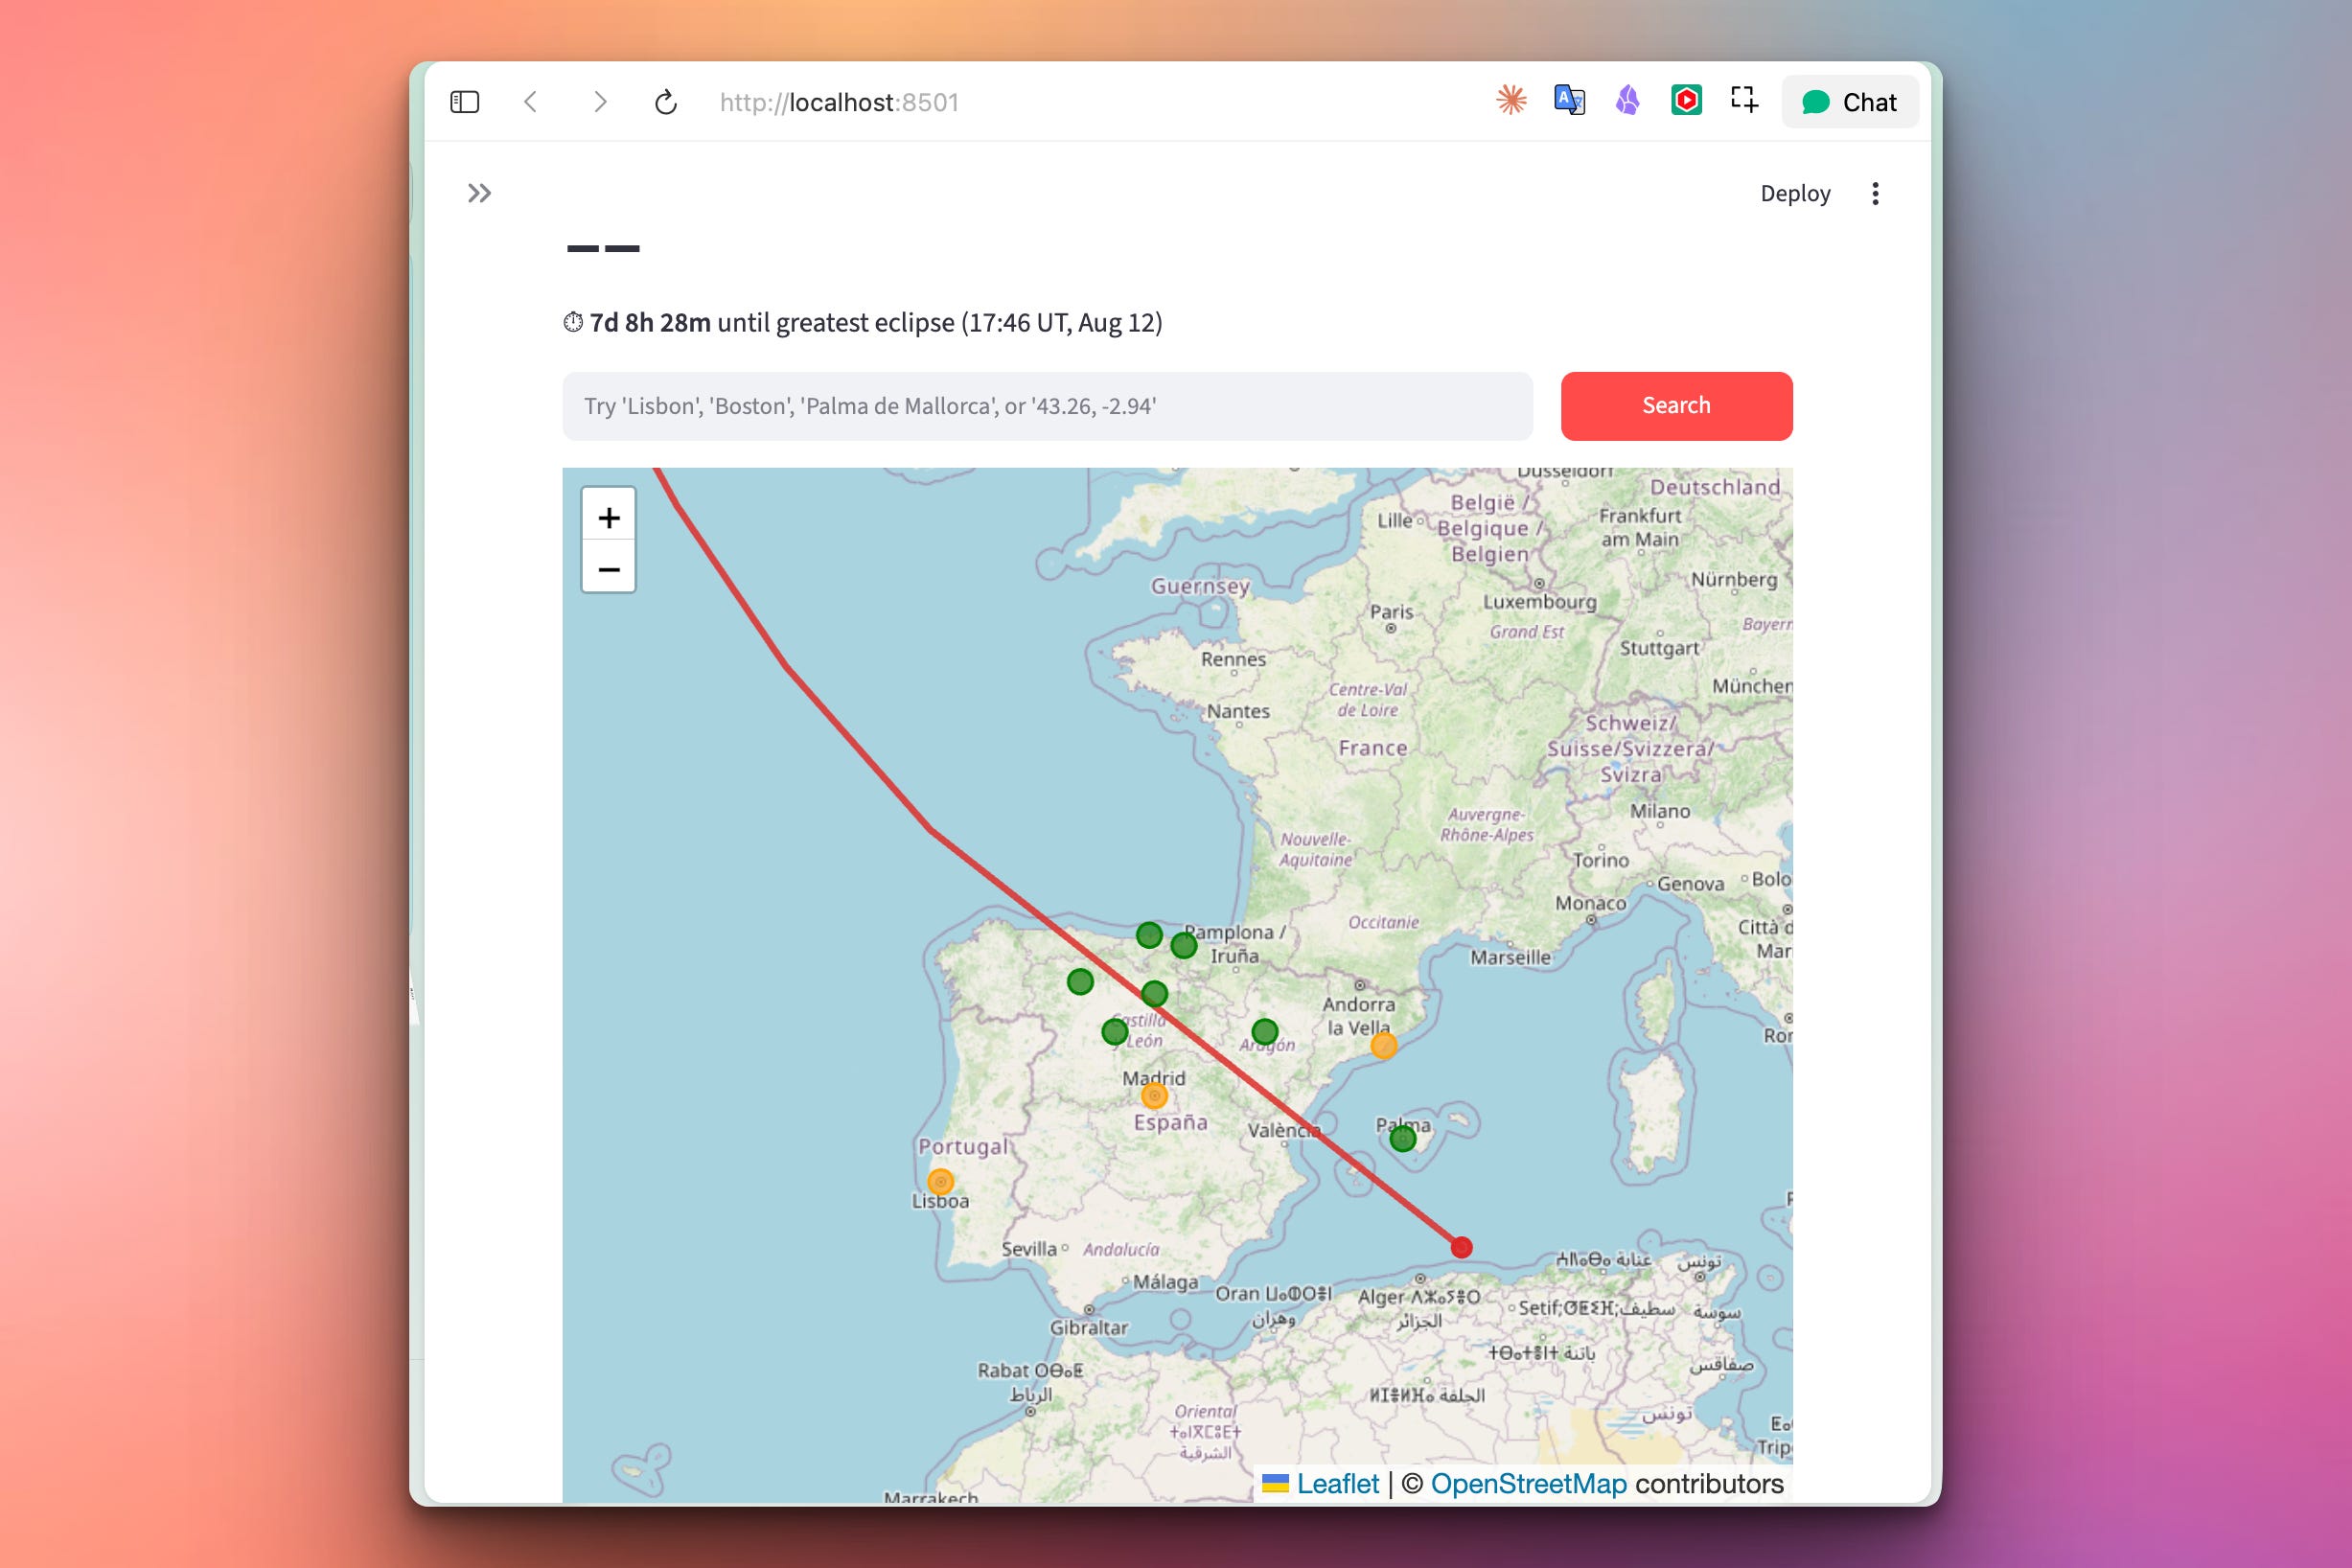
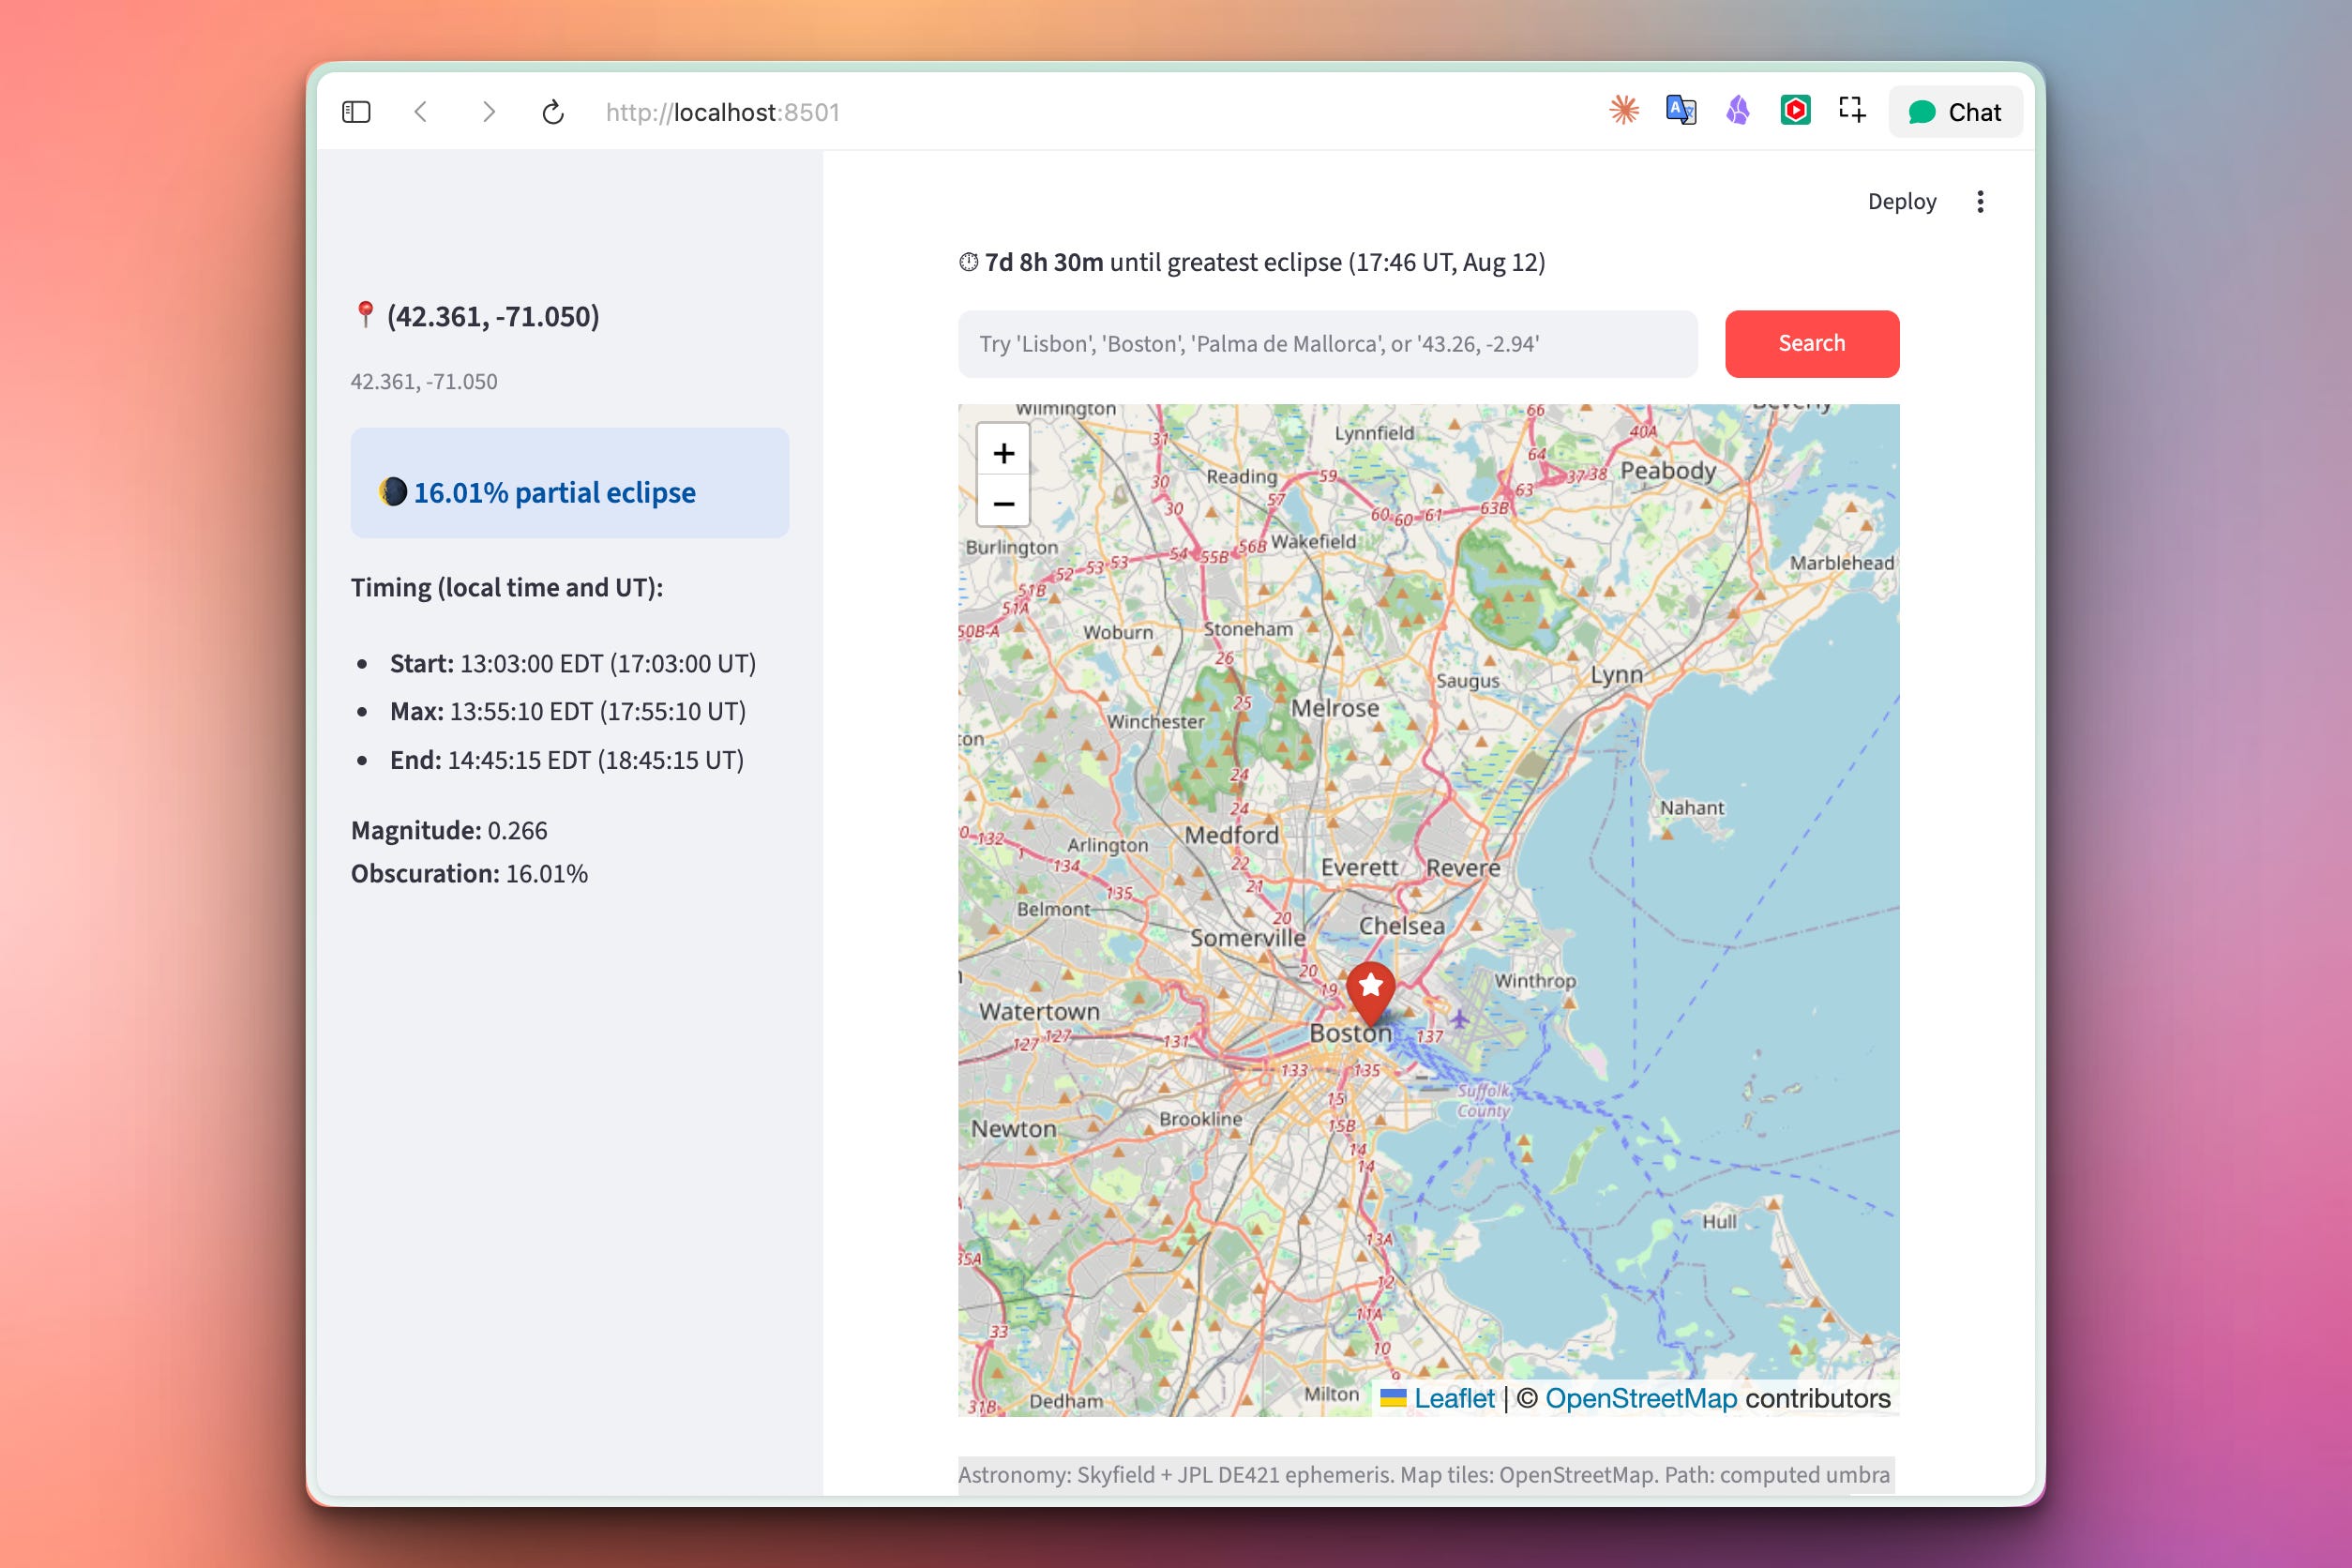
Click anywhere on the map — Boston, Almada, Tokyo, wherever — and the left sidebar populates with the local eclipse info for that exact point, complete with local time conversion. There’s a search box that geocodes any city name in the world, a live countdown to the eclipse, and popups on every featured city. All computed live from the same compute_eclipse() function we built yesterday.
Here the map shows that Boston will have a 16.01% partial eclipse:
Zero JavaScript files. Zero HTML files. Zero CSS files. About 420 lines of Python that read like a normal script.
About the stack
Three new packages, each doing one clean thing on top of Day 1’s foundation.
Streamlit is Python’s most popular framework for turning scripts into web apps. Its whole philosophy is “write a normal Python script; get a web app for free.” No routes, no HTML templates, no request handlers. Every widget (button, text input, map) is a Python function call. st.title("Hello") puts a title on the page. st.button("Click me") adds a button and returns True when clicked. Then the whole script re-runs and your logic reacts.
Streamlit’s re-run model is the one thing that surprises people. Every widget interaction — every click, every keystroke, every zoom on the map — re-runs your entire script from top to bottom. That sounds inefficient, but combined with @st.cache_data for expensive computations and st.session_state for persisting values across re-runs, it’s actually a delightful mental model: no callbacks, no event handlers, just linear code that runs whenever anything changes.
Folium is a Python wrapper around Leaflet.js — the same JavaScript library that powers OpenStreetMap, Airbnb, and most of the interactive maps you’ve ever used online. Folium lets you build a map object in pure Python (folium.Map(), folium.PolyLine(), folium.CircleMarker()) and renders it as an HTML/JS widget. Nice API, zero JS to write.
streamlit-folium is the bridge. Folium alone gives you a beautiful map but it’s one-way — you can display it but users can’t send anything back to Python. streamlit-folium adds st_folium(), a component that renders a Folium map and returns click coordinates, current center, zoom level, and marker interactions as a Python dict. That’s what makes the map bidirectional — clicks flow back to your script, which reruns with the new click, which populates the sidebar. Without this component, our whole “click anywhere to see local eclipse info” flow wouldn’t work.
Understanding the Reusable Engine Pattern
Day 1’s eclipse.py was written as a script — it has a main() function, CLI parsing, colored terminal output. But look at the actual astronomy: compute_eclipse(lat, lon) takes two floats and returns a dict. Pure function. No CLI dependencies, no printing, no side effects other than reading the ephemeris (which is loaded once at module level).
That’s what makes Day 2 short. The first non-import line of eclipse_map.py is:
from eclipse import CITIES, compute_eclipse, format_duration
Everything else — Streamlit widgets, Folium map construction, click handling — is UI code around that pure function. If tomorrow we wanted a REST API version, we’d write a FastAPI file that imports the same three names. If we wanted a Discord bot, same thing. The engine doesn’t care about the interface.
This split — pure engine, thin interface — is one of the most valuable habits a Python developer can build. Every time you catch yourself hardcoding print() calls or hardcoding CLI arguments deep inside computational code, you’re gluing the engine and the interface together, and future-you (or future-teammate) will pay for it.
Understanding Streamlit’s Re-run Model
The Streamlit mental model is genuinely different from anything else in web development, and getting it wrong is the fastest way to end up with a broken app. Here’s the rule: every widget interaction re-runs the entire script from top to bottom.
Type a character in the search box? Whole script reruns. Click a button? Whole script reruns. Pan the map by one pixel? Whole script reruns. Nothing survives between runs by default.
This sounds catastrophic — surely computing the eclipse for 12 cities on every keystroke would be unbearably slow? — but Streamlit gives you two tools that make it work.
@st.cache_data memoizes expensive functions by their arguments. Wrap compute_eclipse in a cached version and it runs once per unique lat/lon:
@st.cache_data(show_spinner=False)
def cached_eclipse(lat: float, lon: float) -> dict:
    return compute_eclipse(round(lat, 3), round(lon, 3))
The round(..., 3) trick is worth calling out. Rounding to 3 decimal places means about 100 meters of precision — way finer than eclipse timing needs — but crucially it makes the cache key stable across nearby clicks. Click one pixel apart on the map, the cache still hits. Without the round, every micro-click would be a cache miss.
st.session_state is a dict-like object that persists across reruns for the current user’s session. Store anything you need to remember:
st.session_state.setdefault("selected", None)
st.session_state.setdefault("map_center", [55.0, -10.0])
st.session_state.setdefault("map_zoom", 3)
Now st.session_state.selected survives across every rerun. When the user clicks the map, we update it; when the script reruns, we read it and populate the sidebar accordingly.
Understanding the Bidirectional Map
The whole app hinges on st_folium() returning click data back to Python. Look at how it’s called:
map_state = st_folium(
    fmap,
    height=600,
    returned_objects=["last_clicked", "last_object_clicked", "center", "zoom"],
    key="eclipse-map",
)
returned_objects is the key argument. It tells the component: “here are the things I care about; give them to me on every rerun.” Then map_state is a Python dict with keys like:
{
    "last_clicked": {"lat": 43.263, "lng": -2.935},   # or None
    "last_object_clicked": None,                       # or {"lat", "lng"} of clicked marker
    "center": {"lat": 55.0, "lng": -10.0},
    "zoom": 3,
    ...
}
We use these three pieces:
# Preserve pan/zoom so it doesn't reset every rerun
if map_state.get("center"):
    st.session_state.map_center = [map_state["center"]["lat"],
                                    map_state["center"]["lng"]]
if map_state.get("zoom") is not None:
    st.session_state.map_zoom = map_state["zoom"]

# React to new clicks
click = map_state.get("last_clicked") or map_state.get("last_object_clicked")
if click is not None:
    new_selected = (click["lat"], click["lng"],
                    f"({click['lat']:.3f}, {click['lng']:.3f})")
    if new_selected != st.session_state.selected:
        st.session_state.selected = new_selected
        st.rerun()
The st.rerun() at the bottom forces a fresh script run — needed because we changed session state after the map rendered. That fresh run picks up the new selected lat/lon and rebuilds the sidebar with the new eclipse info.
Understanding Folium PolyLines and Markers
Drawing the eclipse path is one line:
folium.PolyLine(
    locations=CENTERLINE,   # list of (lat, lon) tuples
    color="#dc2626",        # bold red
    weight=4,
    opacity=0.85,
    tooltip="Eclipse centerline",
).add_to(fmap)
The CENTERLINE list is 21 precomputed (lat, lon) points along the umbra’s track. I computed them once by finding, at each 5-minute step, the (lat, lon) on Earth’s surface where the Sun and Moon appear at exactly zero angular separation. That’s the definition of the shadow’s center. The optimization runs in scipy.optimize.minimize, takes about a second per point, and the output is baked into eclipse_map.py as a Python list — no runtime cost, works offline.
The featured cities are CircleMarker objects colored by coverage:
folium.CircleMarker(
    location=[lat, lon],
    radius=7,
    color=color,
    weight=2,
    fill=True,
    fillOpacity=0.75,
    popup=folium.Popup(popup_html, max_width=220),
    tooltip=name,
).add_to(fmap)
Popups are HTML strings — Folium accepts any HTML you throw at them. For each city, we compute its eclipse info once (cached forever), and stuff the coverage percentage and totality duration straight into the popup body.
Understanding the Sidebar Rendering
Streamlit has a built-in sidebar accessible via st.sidebar. Everything you’d normally do with st.something(...) you can do with st.sidebar.something(...):
def render_sidebar(lat, lon, label):
    st.sidebar.markdown(f"### 📍 {label}")
    st.sidebar.caption(f"{lat:.3f}, {lon:.3f}")

    res = cached_eclipse(lat, lon)

    if not res["visible"]:
        st.sidebar.error("No eclipse visible — Sun below horizon here.")
        return

    pct = res["max_obscuration"] * 100
    if res["in_totality"]:
        st.sidebar.success(
            f"### 🌑 **TOTAL ECLIPSE**\n"
            f"**{format_duration(res['totality_seconds'])}** of totality"
        )
    elif pct >= 90:
        st.sidebar.warning(f"### 🌗 **{pct:.2f}%** partial eclipse")
    else:
        st.sidebar.info(f"### 🌘 **{pct:.2f}%** partial eclipse")
    ...
st.success, st.warning, st.info, st.error are colored callout boxes — perfect for status messages. Green for totality, yellow for deep partials, blue for moderate, red for “not visible.” Zero CSS written.
Understanding the Live Countdown
The countdown line updates every time Streamlit re-runs (which is often, given re-runs happen on every widget interaction). No JavaScript setInterval, no WebSocket — just a normal Python function reading datetime.now():
GREATEST_ECLIPSE_UTC = datetime(2026, 8, 12, 17, 46, tzinfo=timezone.utc)

def countdown_line():
    delta = GREATEST_ECLIPSE_UTC - datetime.now(timezone.utc)
    if delta.total_seconds() <= 0:
        return "🌒 The 2026 eclipse has already happened."
    days = delta.days
    hours, rem = divmod(delta.seconds, 3600)
    minutes, _ = divmod(rem, 60)
    return f"⏱ **{days}d {hours}h {minutes}m** until greatest eclipse"
Between reruns the countdown stays frozen, but the moment anyone interacts with anything — even hovering a marker triggers a re-run — the countdown ticks. Good enough for a friendly display; if you needed literal per-second precision you’d use a small JS component, but that’s out of scope.
Understanding Layout and Ordering
Streamlit renders in the order you call widgets. That’s why we call render_sidebar() before st_folium() — even though visually the sidebar is on the left and the map is on the right, we want the sidebar to reflect the current st.session_state.selected, and the map click handling that might change selected happens after. So the flow is:
Read
st.session_state.selectedRender sidebar based on it (frozen for this rerun)
Render the map
Handle map clicks — if there’s a new one, update session state and
st.rerun()Next rerun starts at step 1 with the new selection
If we rendered the sidebar after the map, the sidebar would always be showing the previous click, one step behind. Small ordering thing, big UX difference.
Setup Instructions
Install dependencies:
pip install streamlit folium streamlit-folium
Three new packages on top of Day 1’s stack. If you skipped Day 1, also install:
pip install skyfield skyfield-data rich geopy timezonefinder numpy
Run it:
streamlit run eclipse_map.py
Streamlit opens the app in your browser automatically at
http://localhost:8501
. First load takes about 6 seconds — most of that is loading the JPL ephemeris and computing eclipse info for the 12 featured cities (all cached after that, so subsequent interactions are instant). Any changes to eclipse_map.py while the server runs get detected and Streamlit prompts you to reload.
Important: both files must be in the same folder. eclipse_map.py imports from eclipse.py. Put them together, cd into that folder, then run.
Practical Use Cases
Ship it publicly for eclipse day. Streamlit Community Cloud hosts Streamlit apps for free directly from a public GitHub repo. Push these two files plus a requirements.txt, connect the repo, and you have a live URL you can share on social media, WhatsApp, or a personal newsletter. Total setup: about ten minutes. Free tier is more than enough for a novelty app that gets shared for a week.
Template for any point-on-map computation. Any problem shaped like “user picks a location on Earth → I compute something for that location” fits this exact pattern: weather forecasts, elevation lookups, travel-time calculations, real estate comparisons, air-quality checks. Swap compute_eclipse for compute_weather and you have a weather app.
Real portfolio project. Two files, ~830 lines total, real astronomy, real interactive UI, deployable in ten minutes. Put it on your CV under Projects with a link to the live version — dramatically stronger than “made a chatbot with the OpenAI API” like every other candidate.
What’s Next
Thursday’s post is a standalone deep-dive on a specific piece of infrastructure. Coming this week: why your app should never talk to your database on port 5432, and the three-line change that makes it 10x faster. Free post, all subscribers get it.
Next week we shift gears again — details on Tuesday.
Solution
Click below to find the complete source code that produces the interactive map with the eclipse path and other data:
Keep reading with a 7-day free trial
Subscribe to Daily Python Projects to keep reading this post and get 7 days of free access to the full post archives.