

Spot the Error #1
Drop your comment in the comments section!

Welcome to “Spot the Error” series! 🎉🎉🎉
Hi everyone! We know how busy you are, so we have found a way to help you improve your coding skills without scheduling long learning sessions.
Introducing “Spot the Error” series!
“Spot the Error” will be short, hands-free queries for you. You can answer them directly from your phone by providing your answer in the comments section below this post.
Why “Spot the Error”?
This type of posts will help you learn Python without having to schedule long learning sessions. They will take only 5 minutes of your day but they will improve your Python skills by making you do critical thinking and interact with other members in the comment section.
How many “Spot the Error” posts per week?
You will receive 2 “spot the error” posts per week, 2 projects, and 1 video. We believe this variety will help you feel less overwhelmed by working on a more realistic number of projects while feeling less overwhelmed.
Please provide your answer to today’s question in the comments section below this post. Here is your “Question” for today:
Today’s question: What is missing from this matplotlib code?
Three lines are missing in the code down below.
import numpy as np
import matplotlib.pyplot as plt
# Parameters
num_steps = 1000
# Generate random walk data
x = np.zeros(num_steps)
y = np.zeros(num_steps)
for i in range(1, num_steps):
angle = np.random.uniform(0, 2 * np.pi)
x[i] = x[i-1] + np.cos(angle)
y[i] = y[i-1] + np.sin(angle)
# Plotting the random walk
plt.figure(figsize=(10, 10))
plt.plot(x, y, linestyle='-', marker='o', markersize=2, alpha=0.75)
...
...
...
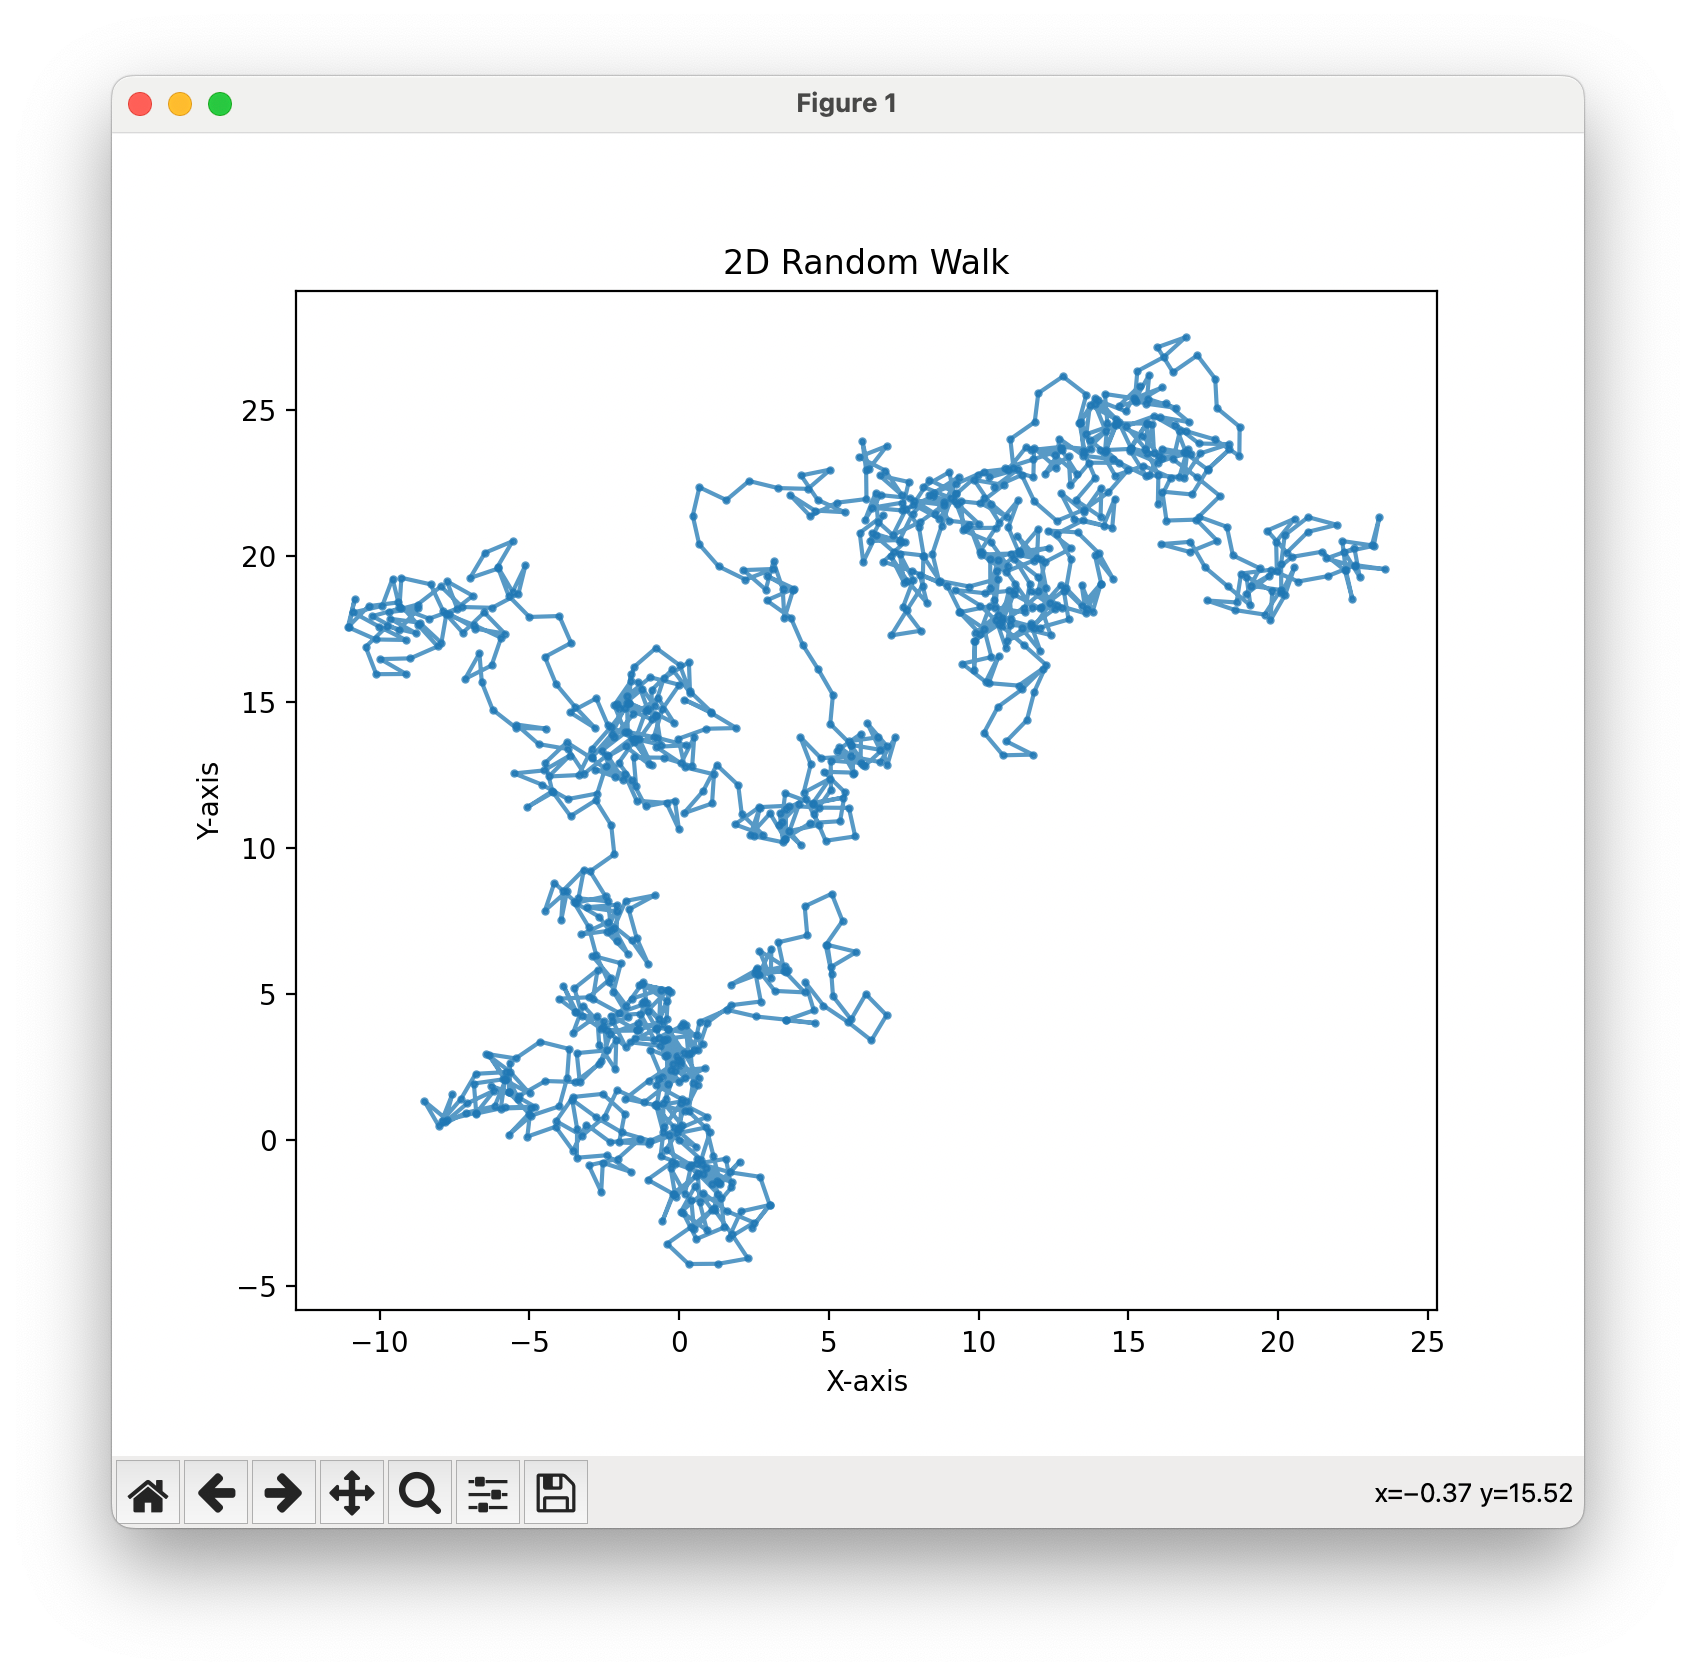
plt.show()What code should be placed in the dots so the code generates the following output?
Provide your answer in the comments below 👇
import numpy as np
import matplotlib.pyplot as plt
# Parameters
num_steps = 1000
# Generate random walk data
x = np.zeros(num_steps)
y = np.zeros(num_steps)
for i in range(1, num_steps):
angle = np.random.uniform(0, 2 * np.pi)
x[i] = x[i-1] + np.cos(angle)
y[i] = y[i-1] + np.sin(angle)
# Plotting the random walk
plt.figure(figsize=(10, 10))
plt.plot(x, y, linestyle='-', marker='o', markersize=2, alpha=0.75, label='Random Walk')
plt.title('2D Random Walk')
plt.xlabel('X-axis')
plt.ylabel('Y-axis')
plt.show()