

Plot data from multiple files using Streamlit
Level: Real-World

This is a legacy project. Please go to the link below to view the updated version of this project.
Project Brief
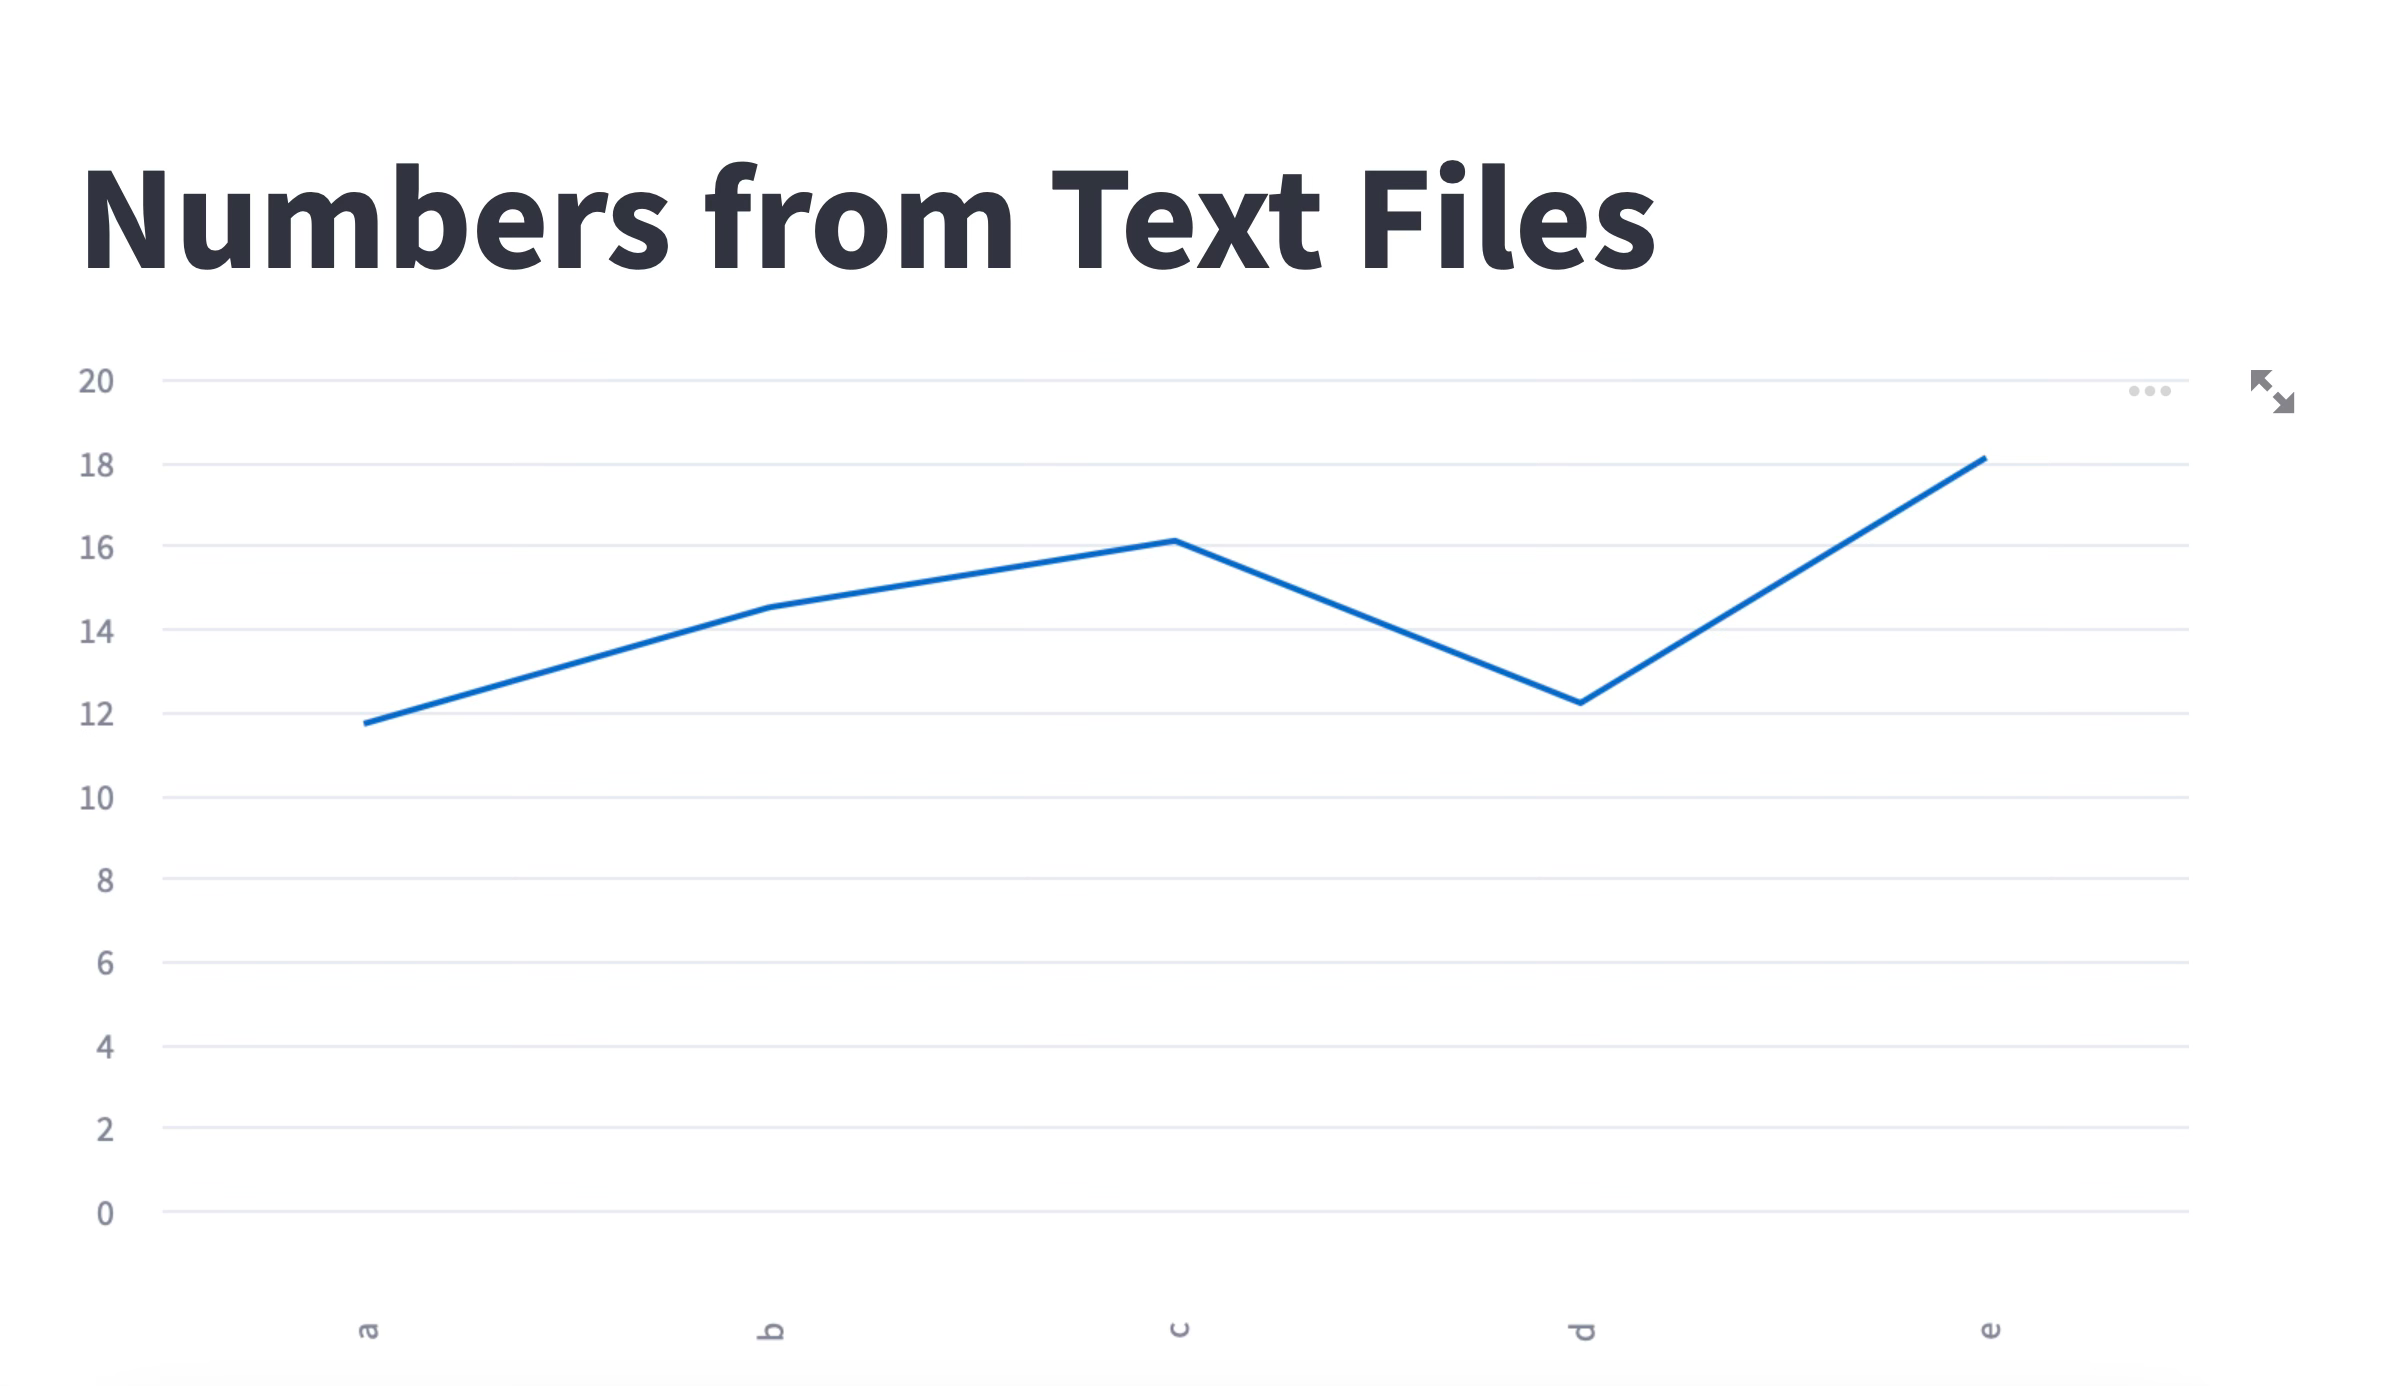
Yesterday’s project focused on plotting data from files using matplotlib. Your task for today’s project is to create the following graph using the Streamlit data visualization library.
Project Instructions
Keep reading with a 7-day free trial
Subscribe to Daily Python Projects to keep reading this post and get 7 days of free access to the full post archives.